## Use Reference Semantics to pass data object to functions by reference.
dat <- new.env(parent = emptyenv())

## Put in some data
dat$iris <- iris
dat$cars <- cars

## Checking the original object.
ls(dat)
## [1] "cars" "iris"

## An example function
f <- function(d) d$N <- nrow(d$iris) + nrow(d$cars)

## Passing the data by reference: It can be modified inside the function.
f(dat)

## Checking the modified object.
ls(dat)
## [1] "cars" "iris" "N"
dat$N
## [1] 200
identical(dat$N, nrow(dat$cars) + nrow(dat$iris))
## [1] TRUE

## In practice, we can use f1(dat), f2(dat), f3(dat), ...
## to continuously update the information/states maintained in "dat".
Wednesday, May 30, 2018
Use R Environment Object to Share and Modify (Big) Data Within Functions
We can use the R environment object just like a list. One advantage is that it will be passed by reference to functions. So it can be modified inside functions without the need to make additional copies. Refer to Environment for more detailed explanation. Following is an example usage.
Wednesday, May 23, 2018
Examining R Profiling Data
rprof <- function(srcfile)
{
    ## Purpose: R Profiling with R "proftools" package.
    ## Arguments:
    ##   srcfile: path to source file.
    ## Return: plots and summary of profiling.
    ## Author: Feiming Chen, Date: 23 May 2018, 10:31
    ## ________________________________________________

    library(proftools)
    pd0 <- profileExpr(source(srcfile))
    pd <- filterProfileData(pd0, select = "withVisible", skip = 4)

    cat("\nSummarize by function -------------------------------------\n")
    print(head(funSummary(pd, srclines = FALSE), 10))

    cat("\nSummarize by call -----------------------------------------\n")
    print(head(callSummary(pd), 10))

    cat("\nHot Execution Paths ---------------------------------------\n")
    print(hotPaths(pd, total.pct = 10.0))

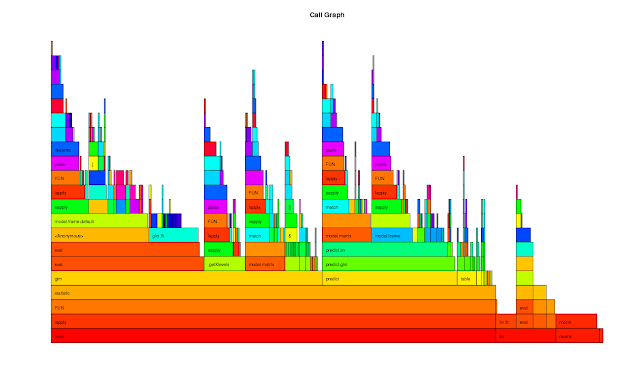
    plotProfileCallGraph(pd, maxnodes = 15)

    flameGraph(pd)

    calleeTreeMap(pd)

    pd
}
if (F) {                                # Unit Test
    srcfile <- system.file("samples", "bootlmEx.R", package = "proftools")
    rprof(srcfile)
}
The output of the Unit Test is as follows:
Summarize by function -------------------------------------
                    total.pct gc.pct self.pct gcself.pct
statistic               80.57   7.21     0.66       0.00
lapply                  80.57   7.21     1.75       0.00
FUN                     80.57   7.21     1.97       0.44
boot                    80.57   7.21     0.00       0.00
glm                     49.13   5.24     0.87       0.22
eval                    32.75   1.97     1.97       0.22
model.frame.default     27.51   1.75     1.31       0.00
sapply                  26.42   3.06     0.87       0.00
predict                 24.45   1.53     0.44       0.00
predict.glm             24.02   1.53     0.44       0.00

Summarize by call -----------------------------------------
                                       total.pct gc.pct self.pct gcself.pct
lapply -> FUN                              80.57   7.21     1.09       0.22
FUN -> statistic                           80.57   7.21     0.66       0.00
statistic -> glm (bootlmEx.R:33)           49.13   5.24     0.87       0.22
boot (bootlmEx.R:39) -> lapply             38.21   3.93     0.00       0.00
boot (bootlmEx.R:44) -> lapply             37.55   3.06     0.00       0.00
eval -> eval                               30.13   1.97     0.87       0.22
glm (bootlmEx.R:33) -> eval                27.73   1.75     0.87       0.00
statistic -> predict (bootlmEx.R:35)       24.45   1.53     0.44       0.00
predict (bootlmEx.R:35) -> predict.glm     24.02   1.53     0.44       0.00
sapply -> lapply                           23.14   3.06     1.75       0.00

Hot Execution Paths ---------------------------------------
 path                            total.pct self.pct
 boot (bootlmEx.R:39)            38.21     0.00
 . lapply                        38.21     0.00
 . . FUN                         38.21     0.00
 . . . statistic                 38.21     0.00
 . . . . glm (bootlmEx.R:33)     24.67     0.44
 . . . . . eval                  13.76     0.44
 . . . . . . eval                13.32     0.22
 . . . . predict (bootlmEx.R:35) 12.23     0.00
 . . . . . predict.glm           12.01     0.44
 . . . . . . predict.lm          11.35     0.22
 boot (bootlmEx.R:44)            37.55     0.00
 . lapply                        37.55     0.00
 . . FUN                         37.55     0.00
 . . . statistic                 37.55     0.00
 . . . . glm (bootlmEx.R:33)     24.45     0.44
 . . . . . eval                  13.97     0.44
 . . . . . . eval                13.54     0.00
 . . . . predict (bootlmEx.R:35) 12.23     0.22
 . . . . . predict.glm           12.01     0.00
 . . . . . . predict.lm          11.35     0.44
 lm (bootlmEx.R:52)              10.92     0.00
Monday, May 21, 2018
Predict with a Classification Tree ("rpart") Model
report.model.rpart <- function(fmla, dat, main = "Classification Tree")
{
    ## Purpose: Report a Classification Tree ("rpart") model and make plots.
    ##          Assume the response is a categorical variable (factor).
    ##          Require package "rpart" and "rpart.plot".
    ## Arguments:
    ##   fmla: formula for the predictive model
    ##   dat: data frame for the training data
    ##   main: Title for the plot
    ## Return:
    ## Author: Feiming Chen, Date: 18 May 2018, 11:41
    ## ________________________________________________

    library(rpart)
    library(rpart.plot)

    ans <- rpart(fmla, dat)

    rpart.plot(ans, main = main)

    mf <- model.frame(fmla, dat)
    Response <- factor(model.response(mf))                  # extract response

    Predicted.Response <- factor(predict(ans, type = "class"))
    err.mis(Response, Predicted.Response, file="Tree-Model-CART")

    if (nlevels(Response) == 2) {
        H0.label <- levels(Response)[1]
        o1 <- sens.spec(Response, Predicted.Response, H0=H0.label)
        print(o1)

        o2 <- sens.spec(Response, Predicted.Response, H0=H0.label, get.ppv = TRUE)
        print(o2)
    }

    ans
}
if (F) {                                # Unit Test
    data(iris)
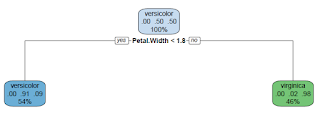
    report.model.rpart(Species ~ ., iris) # Predict 3 species
    report.model.rpart(Species ~ ., subset(iris, Species != "setosa")) # Predict 2 species
}
Unit Test 1: Predict 3 Species
Unit Test 2: Predict 2 Species
Monday, May 14, 2018
Make a ROC plot with possible cutoff points
roc.curve <- function(response, predicted, cutoff = c(seq(0.1, 0.9, 0.1), 0.45, 0.55), ...) {
    ## Purpose: Make a ROC plot with possible cutoff points.
    ##          Require R package "ROCR"
    ## Arguments:
    ##    response: a vector of truth (0/FALSE/"negative" or 1/TRUE/"positive")
    ##    predicted: a vector of prediction (continuous);
    ##    cutoff: a list of values to be plotted on ROC curve.
    ##    ...: passed to "plot".

    ## Return: a ROC plot.
    ## Author: Feiming Chen, Date: 14 May 2018, 15:01
    ## ________________________________________________

    require(ROCR)
    ans <- ROCR::prediction(predicted, response)
    ## ROC for Sensitivity vs. Specificity.
    plot((pp <- ROCR::performance(ans, "sens", "spec")), colorize=T,
         print.cutoffs.at=cutoff, text.adj=c(1.2, 1.2), text.cex=0.7, lwd=2,
         ...)
    grid(col="orange")

    ## Draw a "line of no-discrimination".
    ## Sens = P(X=+ | T=+), Spec = P(X=- | T=-),
    ## if X is independent of T, then Sens + Spec = P(X+)+P(X-) = 1, so the pair
    ## (Sens, Spec) lies on a off-diagonal line.
    abline(c(1, -1), col="gray70", lty=2)
    return(invisible(pp))
}
if (F) {
    roc.curve(rep(c(0,1), 50), runif(100), main = "ROC Curve Test")
}
Tuesday, May 8, 2018
Calculate the sample size required for detecting at least one rare event
sample.size.for.rare.event.detection <- function(alpha = 0.05, M = 0.01)
{
    ## Purpose: Calculate the sample size required for detecting at least one rare event.
    ## Arguments:
    ##   alpha: Type I Error. Sensitivity = 1 - alpha.
    ##   M: Probability for the rare event. Default to 1%.
    ## Return: A minimum sample size required for the detection of rare event
    ##         with (1-alpha) probability (aka. confidence).
    ## Author: Feiming Chen, Date:  8 May 2018, 10:36
    ## ________________________________________________

    N <- ceiling(log(alpha) / log(1 - M))
    N
}
if (F) {                                # Unit Test
    sample.size.for.rare.event.detection() # 299

    ## Detecting 0.5% event with 99% confidence
    sample.size.for.rare.event.detection(alpha = 0.01, M = 0.005) # 919
}
Below is an application example.
Tuesday, May 1, 2018
Calculate the entropy of a signal emulating the classic Shannon definition.
signal.entropy <- function(x)
{
    ## Purpose: Calculate the entropy of a signal, emulating the classic Shannon definition.
    ## Arguments:
    ##   x: A signal vector
    ## Return: An entropy number
    ## Author: Feiming Chen, Date:  1 May 2018, 13:07
    ## ________________________________________________

    x2 <- x^2
    tot <- sum(x2)
    if (tot == 0) {
        H <- NA
    } else {
        p <- x2 / tot
        H <- - sum(p * log10(p))
    }
    H
}
if (F) {                                # Unit Test
    x <- rnorm(100)
    signal.entropy(x)
    signal.entropy(rep(1,100))          # 2
    signal.entropy(rep(1,10000))        # 4
}
Subscribe to:
Posts (Atom)


