compare.tables <- function(d1, d2, by.idx = 1)
{
    ## Purpose: Compare two tables with the same structure by merging them.
    ## Arguments:
    ##    d1: table A
    ##    d2: table B
    ##    by.idx: an index vector to common variables.
    ## Return: a full joined table for comparision

    b <- names(d1)[by.idx]
    d <- full_join(d1, d2, by = b)
    tex.print(d, type = "HTML")
    invisible(d)
}
if (F) {                                # Unit Test
    d1 <- rc()
    d2 <- rc()
    by.idx <- 1:4
    compare.tables(d1, d2, by.idx)
}
Tuesday, December 12, 2017
Compare two tables with the same structure by merging them
List duplicated files in a directory
list.dup.files <- function(p, file.name.head = 20)
{
    ## Purpose: List duplicated files in a directory.
    ## Arguments:
    ##   file.name.head: number of starting characters in the file name to use for duplication detection
    ## Return: a list of file names that are duplicated (by sorted order).
    ## Author: Feiming Chen, Date: 13 Nov 2017, 16:36
    ## ________________________________________________

    p1 <- dir(p)
    p2 <- sort(p1, decreasing = T)
    p3 <- as.character(sapply(p2, function(x) substr(x, 1, file.name.head)))
    p4 <- p2[duplicated(p3)]
    if (length(p4) > 0) {
        cat("Duplicated Older Files:\n")
        print(p4)
    } else {
        cat("NO Duplicated Files.\n")
    }
    file.path(p, p4)
}
if (F) {                                # Unit Test
    p <- "~/tmp/Updated-Databases"
    file.name.head <- 25
    x <- list.dup.files(p, file.name.head)
    file.remove(x)
}
Wednesday, October 18, 2017
Convert all character variables in your data.frame to factors
df.make.factors <- function(df)
{
    ## Purpose: Convert all character variables in your data.frame to factors
    ## Arguments:
    ##   df: a data frame
    ## Return: a data frame with converted factors on those character variables.
    ## Author: Feiming Chen, Date: 17 Oct 2017, 14:26
    ## ________________________________________________

    character_vars <- sapply(df, class) == "character"
    df[, character_vars] <- lapply(df[, character_vars], factor)
    df
}
if (F) {                                # Unit Test
    df <- data.frame(x=c("x", "x", "y"), y=1:3, z=c("1", "3", "3"))
    df.make.factors(df)
}
Monday, October 2, 2017
Display a (numeric) vector in a pretty format
display.vector <- function(x)
{
    ## Purpose: Display a vector in a pretty format
    ## Arguments:
    ##   x: a vector
    ## Return: a png picture for the vector. (each row has 10 elements)
    ## Author: Feiming Chen, Date:  2 Oct 2017, 14:54
    ## ________________________________________________

    N <- length(x)
    n1 <- N %% 10
    if (n1 > 0) {
        n2 <- 10 - n1
        x.add <- rep(NA, n2)
        x <- c(x, x.add)
    }

    x1 <- matrix(x, ncol = 10, byrow = T)
    n2 <- nrow(x1)
    nr <- paste0(10 * (seq.int(n2) - 1) + 1, ": ")
    dimnames(x1) <- list(nr, 1:10)

    tex.print(x1)
}
if (F) {                                # Unit Test
    x <- c(402.6615584,402.1343365,402.5467634,401.835917,402.9268321,404.5185276,406.0735012,408.7713965,408.2033098,411.043676,413.953578,420.6021333,426.6352944,440.9007592,471.5614004,523.8426555,619.173643,782.3175971,1033.289048,1321.267143,1615.935774,1898.979548,2173.03472,2442.864835,2682.25644,2884.575978,3064.278857,3252.58248,3413.084683,3588.447246,3701.244129,3796.824264,3840.251429,3943.184319,4084.131835,4037.30822,4116.338229,4191.71438,4173.699815,4110.847391,4197.181334,4221.081422,4207.343855,4209.140892,4263.463393,4306.872737,4312.087451,4269.522631,4313.924265,4265.306511)
    display.vector(x)
}

tex.print <- function(x, type=c("PNG", "HTML"), file=NULL, caption = file, digits=0, ...) {
    ## Purpose: Generate HTML or PNG representation of a data/table/model object.
    ##          Require R "memisc" package.
    ## Arguments:
    ##   x: an object (table, ftable, data frame, model object, etc. that are acceptable in R "memisc" package.
    ##   type: what to generate --
    ##         "HTML" shows a HTML table in a web browser.
    ##         "PNG" shows a PNG (image) file (require linux commands: latex, dvipng, display).
    ##   file: make a copy of the PNG file with this name.  Also used for the table name.
    ##   caption: table caption.
    ##   digits: number of decimal places to use.
    ##    ...: passed to "toLatex"
    ## Return: Display the data representation and an image file (type="PNG") for insertion.
    ## Author: Feiming Chen, Date: 14 Feb 2017, 11:59
    ## ________________________________________________

    require(memisc)
    type <- match.arg(type)

    switch(type,
           HTML = {
               ## Show HTML table in a Web Browser
               memisc::show_html(x)
           },
           PNG = {
               ## Generate LaTeX and PNG Image file
               r <- toLatex(x, ..., digits=digits, show.vars=TRUE)
               f <- file("X.tex", "w")
               writeLines(c("\\documentclass{article}",
                            "\\usepackage{booktabs}",
                            "\\usepackage{dcolumn}",
                            "\\begin{document}",
                            "\\pagenumbering{gobble}"), f)
               if (!is.null(file)) writeLines("\\begin{table}  \\centering", f)

               writeLines(r, f)

               if (!is.null(caption)) {
                   writeLines(paste0("\\caption{", caption, "} \\end{table}"), f)
               }

               writeLines("\\end{document}", f)
               close(f)

               system("latex X.tex >/dev/null") # Generate DVI file from LaTeX file (X.tex -=> X.dvi)
               system("dvipng -q* -o X.png -T tight -D 200 X.dvi >/dev/null") # convert to PNG file with Tight box and Resolution of 200
               system("display X.png &")                                     # display the PNG file.
               file.remove("X.tex", "X.log", "X.aux", "X.dvi")

               if (!is.null(file)) file.copy("X.png", paste0(file,".png"), overwrite = T)
               if (!grepl("/tmp", getwd())) {
                   file.copy("X.png", "~/tmp/X.png", overwrite = T)
               }
           }
           )
    invisible(NULL)
}
Thursday, September 7, 2017
Extracts all calls to a function (except for those in standard packages)
my.fun_calls <- function(f)
{
    ## Purpose: Extracts all calls to a function (except for those in standard packages) in a function
    ##          Differs from pryr::fun_calls by excluding basic functions.
    ## Arguments:
    ##   f: a function
    ## Return: All calls to a function (that are not in standard packages, e.g. base, stats, etc.)
    ## Author: Feiming Chen, Date:  7 Sep 2017, 11:23
    ## ________________________________________________

    if (is.function(f)) {
        my.fun_calls(body(f))
    } else if (is.call(f)) {
        fname <- as.character(f[[1]])
        if (identical(fname, ".Internal")) fname3 <- NULL
        f1 <- try(pryr::where(fname), silent = TRUE)
        if (is.tryerror(f1)) {
            if (fname[1] == "::") {   # Example: pryr::where  fname = c("::", "pryr", "where")
                fname3 <- paste0(fname[2], fname[1], fname[3])
            } else {
                fname3 <- NULL
            }
        } else {
            fname2 <- environmentName(f1)
            if (fname2 %in% c("base", "package:stats", "package:graphics", "package:grDevices", "package:utils", "package:datasets", "package:methods")) {
                fname3 <- NULL
            } else {
                if (fname2 == "R_GlobalEnv") {
                    fname3 <- fname
                } else {                # attach package name if other than Global Environment
                    fname2m <- sub("package:", "", fname2) # remove "package:" prefix.
                    if (fname2m == "") {
                        fname3 <- paste0(fname)
                    } else {
                        fname3 <- paste0(fname2m, "::", fname)
                    }
                }
            }
        }

        if (F) fun_calls(lm)            # for testing purpose only

        unique(c(fname3, unlist(lapply(f[-1], my.fun_calls), use.names = FALSE)))
    }
}
if (F) {                                # Unit Test
    my.fun_calls(lm)                    # NULL

    sort(my.fun_calls(my.fun_calls))
    ## "is.tryerror"     "my.fun_calls"    "pryr::fun_calls" "pryr::where"
}


## Test for the try-error class (from "try" function)
is.tryerror <- function(x) inherits(x, "try-error")
Wednesday, June 28, 2017
Span: A Predicate Functional that finds the location of the longest sequential run of elements where the predicate is true
Span <- function(f, x)
{
    ## Purpose: A Predicate Functional that finds the location of the longest sequential run
    ##          of elements where the predicate is true.
    ## Arguments:
    ##   f: a predicate (a function that returns a single TRUE or FALSE)
    ##   x: a list or data frame
    ## Return: The location of the longest sequential run of elements where the predicate is true.
    ## Author: Feiming Chen, Date: 28 Jun 2017, 09:45
    ## ________________________________________________

    y <- rle(Where(f, x))
    z <- y$lengths
    w <- which.max(z)          # position of the segment with longest sequential run of TRUE
    pos.end <- sum(z[1:w])
    pos.start <- pos.end - z[w] + 1
    c(start=pos.start, end=pos.end)
}
if (F) {                                # Unit Test
    x <- c(3, 1, NA, 4, NA, NA, NA, 5, 9, NA, NA)
    Span(is.na, x)
    ## start   end
    ##     5     7
}

Where <- function(f, x)
{
    ## Purpose: A Predicate Functional
    ## See other Predicate Functionals: Filter(), Find(), Position()
    ## See other Functionals: Map(), Reduce()
    ## Arguments:
    ##   f: a predicate (a function that returns a single TRUE or FALSE) (e.g. is.character, all, is.NULL)
    ##   x: a list or data frame
    ## Return: a logical vector
    ## Author: Feiming Chen, Date: 28 Jun 2017, 09:45
    ## ________________________________________________

    vapply(x, f, logical(1))
}
if (F) {                                # Unit Test
    df <- data.frame(x = 1:3, y = c("a", "b", "c"), stringsAsFactors = T)
    Where(is.factor, df)
    ## Compare with:
    Filter(is.factor, df)
    Find(is.factor, df)
    Position(is.factor, df)
}
Thursday, June 22, 2017
Draw a data frame as a R plot
my.table.plot0 <- function(x,
                           highlight.matrix = NULL,
                           main = "Table", title2 = NULL, size = 20,
                           bold.lastrow = FALSE, bold.lastcol = FALSE
                           )
{
    ## PURPOSE: Draw a data frame as a R plot. Require R package "gridExtra".
    ## ARGUMENT:
    ##    x: a data frame
    ##    highlight.matrix: if provided a logical matrix (same dimension as "x"). Then "TRUE" cells will be highlighted.
    ##    main: title for the plot
    ##    title2: additional title with more verbose text
    ##    size: text size of table text
    ##    bold.lastrow: if T, make the last row bold font.
    ##    bold.lastcol: if T, make the last column bold font.
    ## RETURN: a plot
    ## DATE: 21 Nov 2016, 15:46
    ## -----------------------------------------------------

    x <- as.data.frame(x)
    n1 <- nrow(x)
    n2 <- ncol(x)
    cl <- matrix("black", n1, n2)
    cl[is.na(x)] <- "gray"

    ## Bold Total Column and Row
    cl2 <- cl
    cl2[] <- "plain"
    if (bold.lastrow) {
        cl2[n1,] <- "bold"
    }
    if (bold.lastcol) {
        cl2[, n2] <- "bold"
    }

    require(gridExtra)
    table_theme <- ttheme_default(base_size = size,
                                  core = list(fg_params=list(col=cl, fontface = cl2)))
    ## Highlight Cells
    if (!is.null(highlight.matrix)) {
        cl3 <- cl
        z <- ttheme_default()$core$bg_params$fill # default color
        z1 <- rep(z, length.out = nrow(cl3))
        for (i in 1:ncol(cl3)) cl3[,i] <- z1
        cl3[highlight.matrix] <- "yellow"
        table_theme$core$bg_params$fill <- cl3
    }

    plot.new()
    gridExtra::grid.table(as.data.frame(x), theme=table_theme)
    ## Title Text
    t2 <- ifelse(is.null(title2), "", paste0("\n", graph.title.split.lines(title2, sep=" ", num.chars = 40)))
    title(main = paste0(main, t2))

}
if (F) {                                # Unit Test
    x <- data.frame(Type=c('Car', 'Plane'), Speed=c(NA, 200))
    my.table.plot0(x)
    my.table.plot0(x, main='Test', title2='a very complex test', size=30, bold.lastcol = T, highlight.matrix = matrix(c(NA, F, F, T) , 2, 2))
    x <- data.frame(Type=rep('Car', 20), Speed=rep(100, 20))
    my.table.plot0(x)
}

my.table.plot <- function(x, highlight.matrix = NULL, bold.lastrow = FALSE, n = 20, ...)
{
    ## Purpose: Split a data frame to fit in each page and call "my.table.plot0".
    ## Arguments:
    ##   x: a data frame or matrix
    ##   highlight.matrix: if provided a logical matrix (same dimension as "x"). Then "TRUE" cells will be highlighted.
    ##   bold.lastrow: if T, make the last row bold font.
    ##   n: how many rows to fit into each page.
    ##   ...: pass to "my.table.plot0".
    ## Return: multiple plots to plot the data matrix.
    ## Author: Feiming Chen, Date:  5 Jul 2017, 15:16
    ## ________________________________________________

    x <- as.data.frame(x)
    N <- nrow(x)
    if ( N <= n ) {
        my.table.plot0(x, highlight.matrix = highlight.matrix, bold.lastrow = bold.lastrow, ...)
    } else {
        s <- rep(seq.int(N %/% 20 + 1), each = n, length.out = N)
        xs <- split(x, s)

        ng <- length(xs)                # number of pages
        bold.lastrow.list <- c(rep(FALSE, ng-1), bold.lastrow)

        if (is.null(highlight.matrix)) {
            mapply(my.table.plot0, xs, bold.lastrow = bold.lastrow.list, MoreArgs = list(...))
        } else {
            ys <- split(highlight.matrix, s)
            mapply(my.table.plot0, xs, highlight.matrix = ys, bold.lastrow = bold.lastrow.list, MoreArgs = list(...))
        }
    }
}
if (F) {                                # Unit Test
     x <- data.frame(Type=rep('Car', 50), Speed=rep(100, 50))
     h <- matrix(rep(c(F, T), 50), ncol=2)
     my.table.plot(x, highlight.matrix = h, bold.lastrow = T)
}


Wednesday, June 21, 2017
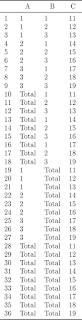
Add a "Total" level to each specified categorical variable in the data frame
df.add.total.category  <- function(dat, var.list, new.level.label = "Total")
{
    ## Purpose: Add a "Total" level to each specified categorical variable in the data frame.
    ## Arguments:
    ##   dat: a data frame with several categorical variables for making tables.
    ##   var.list: a list of variable names in "dat".
    ##   new.level.label: the name for the new "total" level for the specified variable.
    ## Return:
    ## Author: Feiming Chen, Date: 21 Jun 2017, 13:02
    ## ________________________________________________

    if ( missing(var.list) )  {
        var.list <- names(dat)
    }

    d0 <- dat                           # to make new label across all variables
    lapply(var.list,  function( v )  {
        d <- dat
        d[[v]] <- new.level.label
        d0[[v]] <<- new.level.label
        d
    }) -> dd

    do.call(rbind, c(list(dat), dd, list(d0)))
}
if (F) {                                # Unit Test
    dat <- data.frame(A=gl(3,3), B=gl(3, 1, 9), C=11:19)
    df.add.total.category(dat, var.list=c("A", "B"))
}

Monday, June 19, 2017
Put unique elements of a string vector into one long string
paste.unique.string  <- function(x, sep = "/")
{
    ## Purpose: Put unique elements of a string vector into one long string.
    ## Arguments:
    ##    x: a string vector
    ##    sep: what separator to use when pasting all unique elements together.
    ## Return:  a single string with unique elements of "x".
    ## Author: Feiming Chen, Date: 19 Jun 2017, 14:00
    ## ________________________________________________

    paste0(unique(x), collapse = sep)
}
if (F) {                                # Unit Test
    paste.unique.string(c("a", "b", "a", "b")) # "a/b"
}
Add "0" to the front of numbers to make n-digit string
prepend.zero.to.numbers  <- function(x, n = NULL, pad.char = "0")
{
    ## Purpose: Add "0" to the front of numbers to make n-digit string.
    ## Arguments:
    ##   x: a vector of integers/characters
    ##   n: Number of total digits after padding with zero. Default to
    ##      using the largest number to calculate "n".
    ##   pad.char: what character to pad.  Default to "0".
    ## Return: a character vector with nuumbers padded with zero's in the head.
    ## Author: Feiming Chen, Date: 19 Jun 2017, 13:19
    ## ________________________________________________

    x1 <- as.character(x)
    y <- nchar(x1)
    if (is.null(n)) n <- nchar(as.character(max(x)))
    y1 <- n - y                         # how long is the padding for each number
    pad.vector <- sapply(y1, function(w) paste(rep(pad.char, w), collapse = ""))
    paste0(pad.vector, x1)
}
if (F) {                                # Unit Test
    x <- c(2, 14, 156, 1892)
    prepend.zero.to.numbers(x)          # "0002" "0014" "0156" "1892"
    prepend.zero.to.numbers(x, pad.char = "X") # "XXX2" "XX14" "X156" "1892"
    prepend.zero.to.numbers(x, n = 6)          # "000002" "000014" "000156" "001892"
    y <- c("A", "BC", "DEF")
    prepend.zero.to.numbers(y, 3) # "00A" "0BC" "DEF"
}
Parse a string to generate a data frame
parse2data.frame  <- function(x)
{
    ## Purpose: Parse a string to generate a data frame.
    ## Arguments:
    ##   x: a string with header and multiple rows of text that resembles a data frame.
    ##      Fields are separated by comma.
    ## Return: a data frame
    ## Author: Feiming Chen, Date: 19 Jun 2017, 10:12
    ## ________________________________________________

    d <- read.csv(textConnection(x), as.is = T)
    i <- sapply(d, is.character)
    d[i] <- lapply(d[i], trimws)
    d
}
if (F) {                                # Unit Test
    a =
"

  Test, ID, Name
  t1 ,  3,  Sun
  t2 ,  5,  Moon
  t3,   2,  Earth

"
    b <- parse2data.frame(a)
    str(b)
    ## 'data.frame':    3 obs. of  2 variables:
    ##  $ ID  : int  3 5 2
    ##  $ Name: Factor w/ 3 levels " Earth"," Moon",..: 3 2 1
}
Thursday, June 15, 2017
Tokenize a string into a vector of tokens
tokenize.string <- function(x, split = "[ ,:;]+")
{
    ## Purpose: Tokenize a string into a vector of tokens
    ## Arguments:
    ##   x: a string or a vector of strings
    ##   split: split characters (regular expression)
    ## Return: a character vector (if "x" is a string) or a list of character vectors.
    ## Author: Feiming Chen, Date: 15 Jun 2017, 15:01
    ## ________________________________________________

    ans <- strsplit(x, split="[ ,:;]+", fixed=F)
    if (length(x) == 1) ans <- ans[[1]]
    ans
}
if (F) {                                # Unit Test
    x <- "IND,  UNR   INC ; TCU"
    tokenize.string(x)
    ## [1] "IND" "UNR" "INC" "TCU"
    tokenize.string(rep(x, 3))
    ## [[1]]
    ## [1] "IND" "UNR" "INC" "TCU"

    ## [[2]]
    ## [1] "IND" "UNR" "INC" "TCU"

    ## [[3]]
    ## [1] "IND" "UNR" "INC" "TCU"
}
Wednesday, June 14, 2017
Count the number of distinct values in a vector or distinct rows in a data frame
N.levels <- function(x)
{
    ## Purpose: Count the number of distinct values in a vector or distinct rows in a data frame
    ## Arguments:
    ##    x: a vector (numeric or string), or a data frame.
    ## Return: a count for the distinct values/rows in the vector or data frame.
    ## Author: Feiming Chen, Date: 20 Mar 2017, 10:58
    ## ________________________________________________

    sum(!duplicated(x))
}
if (F) {                                # Unit Test
    N.levels(c(1,2,1,3))                # 3
    N.levels(c("a", "b", "a"))          # 2
    x <- data.frame(a=c(1,2,1), b=c(1, 2, 1))
    N.levels(x) # 2
}
Tuesday, June 6, 2017
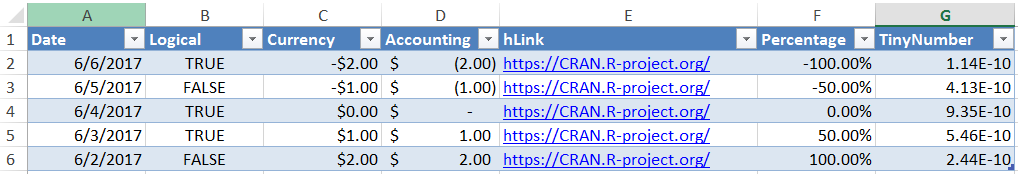
Write data tables to Excel (.xlsx) file
wxls <- function(x, file = "test", ...)
{
    ## Purpose: Write data tables to Excel (.xlsx) file.
    ##          Require package "openxlsx".
    ## Arguments:
    ##   x: a data frame or a list of data frames.
    ##   file: a naked file name with no extension.
    ##   ...: passed to "write.xlsx".
    ## Return: Generate an Excel (.xlsx) file.
    ## Author: Feiming Chen, Date:  6 Jun 2017, 15:11
    ## ________________________________________________

    require(openxlsx)
    f <- paste0(file, ".xlsx")

    write.xlsx(x, file = f, asTable = TRUE,
               creator = "Feiming Chen",
               tableStyle = "TableStyleMedium2",   ...)
}
if (F) {                                # Unit Test
    df <- data.frame("Date" = Sys.Date()-0:4,
                     "Logical" = c(TRUE, FALSE, TRUE, TRUE, FALSE),
                     "Currency" = paste("$",-2:2),
                     "Accounting" = -2:2,
                     "hLink" = "https://CRAN.R-project.org/",
                     "Percentage" = seq(-1, 1, length.out=5),
                     "TinyNumber" = runif(5) / 1E9, stringsAsFactors = FALSE)
    class(df$Currency) <- "currency"
    class(df$Accounting) <- "accounting"
    class(df$hLink) <- "hyperlink"
    class(df$Percentage) <- "percentage"
    class(df$TinyNumber) <- "scientific"

    wxls(df)

    wxls(list(A = df, B = df, C= df))   # write to 3 separate tabs with corresponding list names.
}
Monday, June 5, 2017
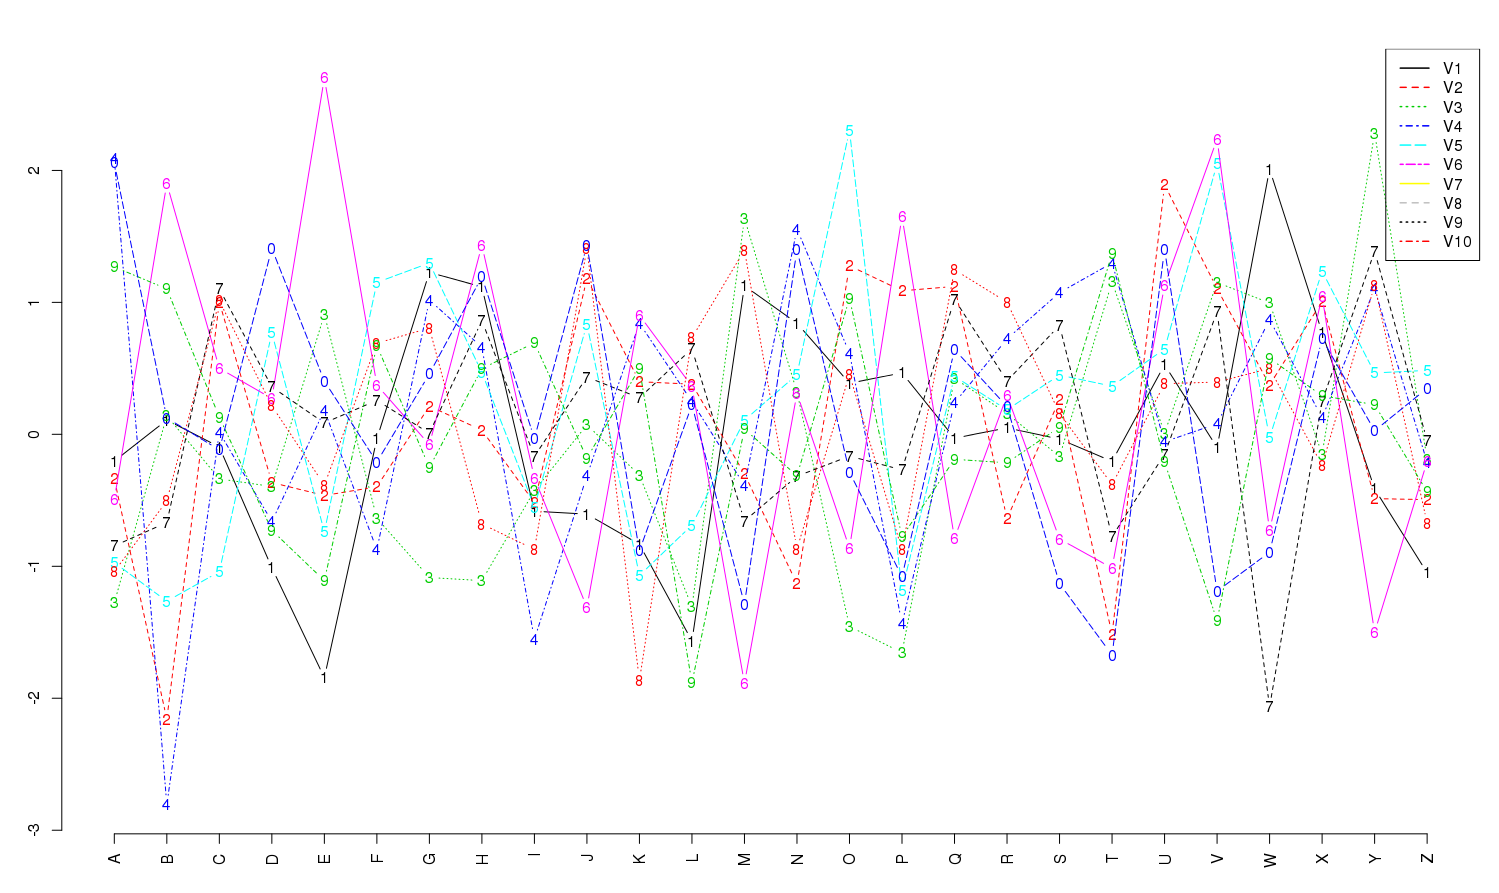
Plot "y" against "x" where "x" is a vector of labels
my.plot.vs.label <- function(x, y, ...)
{
    ## Purpose: Plot "y" against "x" where "x" is a vector of labels (string)
    ## Arguments:
    ##   x: a string vector (labels)
    ##   y: a numeric vector or matrix
    ##   ...: passed to "matplot"
    ## Return: a plot
    ## Author: Feiming Chen, Date:  5 Jun 2017, 14:46
    ## ________________________________________________

    s <- seq(x)
    matplot(s, y, type="b", axes = F, xlab ="", ylab="", ...)
    axis(side=2)
    axis(side=1, at=s, labels=x, las=2)

    yn <- ncol(y)
    yna <- names(y)
    if (!is.null(yn) && !is.null(yna)) {
        legend("topright", legend=yna, col=1:yn, lwd=1.5, lty=1:yn)
    }
}
if (F) {                                # Unit Test
    x <- LETTERS
    y <- matrix(rnorm(260), ncol=10)
    my.plot.vs.label(x, y)
    y2 <- as.data.frame(y)
    my.plot.vs.label(x, y2)
}
Friday, June 2, 2017
Read/Import all CSV files in a specified directory
batch.read.csv.files <- function(p)
{
    ## Purpose: Read/Import all CSV files in a specified directory.
    ##          Require package "readr".
    ## Arguments:
    ##   p: a file directory with CSV files.
    ## Return:
    ##   a list, each element is a data frame (imported from the file) and its name is the corresponding file name.
    ## Author: Feiming Chen, Date:  2 Jun 2017, 11:09
    ## ________________________________________________

    file.list <- list.files(p, pattern=".csv", full.names = TRUE, ignore.case = TRUE)

    if (length(file.list) > 0) {
        dat <- lapply(file.list, readr::read_csv)
        names(dat) <- sapply(file.list, basename)
    } else dat <- list()

    cat("Import", length(dat), "CSV Files.\n")
    dat
}
Wednesday, May 3, 2017
Feature Filtering with Natural B-Splines for Functional Modeling Application
feature.filtering.ns <- function(X, df = 10, graph = FALSE)
{
    ## Purpose: Feature Filtering with Natural B-Splines for Functional Modeling Application.
    ##          Preprocess the feature data (design matrix) to enforce a natural regularization.
    ##          In other words, project each observation to each of "df" axis represented by B-spline Basis.
    ## Arguments:
    ##   X: a design matrix (predictors) of dimension N x p (N observations, p predictors).
    ##      If "X" is a vector, convert it to a matrix with one row.
    ##   df: Degrees of Freedom (number of natural B-splines basis functions to approximate the (continuous) coefficient function.
    ##       Beta (p x 1) = H (p x df) Theta (df x 1), where H represents "df" number of continuous basis functions
    ##       in the coefficient space, and Theta represents the linear combination parameters for constructing Beta.
    ##   graph: if TRUE, plot each observation (each row of X) as a time series,
    ##          its projection to the reduced space (formed by the natural B-spline basis),
    ##          and the natural B-spline basis.
    ## Return: Preprocessed Features (X H) of dimension N x df, which can be used as "df" input into a predictive model.
    ##         X Beta = X H Theta = (X H) Theta
    ## Author: Feiming Chen, Date:  3 May 2017, 12:12
    ## ________________________________________________

    if (is.vector(X)) X <- matrix(X, nrow = 1)

    p <- ncol(X)                        # number of predictors
    require(splines)
    ## B-splines for Natural Cubic Spline: a p x df  matrix.
    H <- ns(1:p, df=df)

    ## Filtered Features.  Dimensions: N x p  p x df = N x df
    ## Project each observation "x" into one of "df" Basis (each column of H matrix) so that
    ## each "x" is represented by "df" coefficient (coordinates in the coordinate system defined by "H")
    ans <- X %*% H

    if (graph) {
        par(mfrow=c(3,1))
        matplot(t(X), type = "b", xlab = "Feature Index", ylab = "Observation Value",
                main = "Original Features (High-Dimensional Space)")
        matplot(H, type="b", xlab = "Index", ylab ="Value", main="Natural B-spline Basis")
        matplot(t(ans), type = "b", xlab = "Feature Index", ylab = "Observation Value",
                main = "Filtered Features (Low-Dimensional Space)")
        par(mfrow=c(1,1))
    }

    ans
}
if (F) {                                # Unit Test
    X <- matrix(rnorm(1000), 20, 50)
    y <- feature.filtering.ns(X)
    y <- feature.filtering.ns(X, df = 20)

    x <- rnorm(100)
    y <- feature.filtering.ns(x, graph=T)
}

Tuesday, April 25, 2017
Apply a stamp (text string) to each page of a PDF file
my.pdf.stamp <- function(stamp.text="Stamp", pos=c(0.4, 0.9), pdf.in.file,  pdf.out.file)
{
    ## Purpose: Apply a stamp (text string) to each page of a PDF file.
    ##          Requires Linux program "pdftk".
    ## Arguments:
    ##   pdf.in.file: Input PDF file.
    ##   stamp.text: a vector of strings (stamps). Each value will be stamped on the corresponding page of the PDF file.
    ##               Its values will be recycled to match the total number of pages in the input PDF file.
    ##   pos: position of the stamp text (located between [0,1] X [0,1])
    ##   pdf.out.file: Output PDF file with the stamps.
    ## Return: PDF file with the stamps.
    ## Author: Feiming Chen, Date: 25 Apr 2017, 10:42
    ## ________________________________________________

    p1 <- pdf.file.page.number(pdf.in.file)
    p2 <- length(stamp.text)
    if (p1 != p2) stamp.text <- rep(stamp.text, length.out = p1)

    ## burst the PDF file into single page PDF's
    f <- "page_%05d.pdf"
    fs <- "stamp_%05d"
    fs2 <- "stamp_%05d-Plot.pdf"
    fo <- "out_%05d.pdf"
    system(paste("pdftk", pdf.in.file, "burst output", f))

    for (i in 1:p1) {
        X(text.in.plot(stamp.text[i], cex = 2, pos = pos), file =  sprintf(fs, i), open.pdf=F)
        system(paste("pdftk", sprintf(f, i), "stamp", sprintf(fs2, i), "output", sprintf(fo, i)))
    }

    merge.file.list <- paste(sapply(1:p1, function(i) sprintf(fo, i)), collapse = " ")

    system(paste("pdftk", merge.file.list, "cat output", pdf.out.file))
}
if (F) {                                # Unit Test
    dir.create("tmp"); setwd("tmp")
    pdf("test.pdf"); replicate(3, plot(rnorm(100))); dev.off()

    pdf.in.file <- "test.pdf"
    pdf.out.file <- "result.pdf"
    stamp.text <- LETTERS[1:3]
    pos <- c(0.4, 0.9)

    my.pdf.stamp(stamp.text, pos=pos, pdf.in.file,  pdf.out.file)
}
pdf.file.page.number <- function(fname) {
    ## Return the total number of pages in a PDF file.
    ## Require Linux program "pdfinfo"
    a <- pipe(paste0("pdfinfo '", fname, "' | grep Pages | cut -d: -f2"))
    page.number <- as.numeric(readLines(a))
    close(a)
    page.number
}
if (F) {
    ## pdf.file.page.number("ALL-Plots.pdf")
}
text.in.plot <- function(x, cex=1, pos=c(0.5, 0.5)) {
    ## "x" is a string.  Put "x" in the center of a plot.  For putting
    ## text summary in a PDF file that is mostly plots.
    ## "pos" is the position of the text string
    ## "cex" is the expansion ratio of the text string
  plot(c(0, 1), c(0, 1), type = "n", main = "", xlab = "", ylab = "", xaxt="n", yaxt="n", axes = F, mar=c(0,0,0,0), oma=c(0,0,0,0))
  text(pos[1], pos[2], x, cex=cex)
}
if (F) {
    text.in.plot("good", cex=5)
    text.in.plot("bad", pos=c(0.1, 0.1))
}
X <- function(expr, file="test", open.pdf = TRUE) {
    ## USED IN UNIX!
    ## Generate a PDF file based on evaluation of expr and open it
    ## Put multiple plot commands like "{ cmd1; cmd2; cmd3; cmd4 }".
    ## USAGE: xpdf(plot(sig1))
    graphics.off()
    ## png("~/tmp/plot.png", width=600, height=600)
    r <- my.pdf(file)
    ans <- eval(expr)
    dev.off()
    ## system("convert ~/tmp/plot.pdf ~/tmp/plot.png")
    if (open.pdf) open.pdf(r$plot)
    invisible(ans)
}
if (F) {
    X(plot(rnorm(100)))
    a <- X({plot(a <- rnorm(100)); a})
    X({plot(a <- rnorm(100)); hist(a); boxplot(a); dotchart(a); qqnorm(a); plot(lm(a~seq(a)))})
}
open.pdf <- function(file) {
    ## Open a PDF file.
    system(paste("evince ", file, " &", sep=""))
    cat("See Plot In: ", file, "\n")
}
Return the total number of pages in a PDF file.
pdf.file.page.number <- function(fname) {
    ## Return the total number of pages in a PDF file.
    ## Require Linux program "pdfinfo"
    a <- pipe(paste0("pdfinfo '", fname, "' | grep Pages | cut -d: -f2"))
    page.number <- as.numeric(readLines(a))
    close(a)
    page.number
}
if (F) {
    ## pdf.file.page.number("ALL-Plots.pdf")
}
Friday, April 21, 2017
Rename all files in a directory according to a pattern (regular expression)
batch.rename.file <- function(pattern, replacement, path=".")
{
    ## Purpose: Rename all files in a directory according to a pattern (regular expression).
    ## Arguments:
    ##   pattern: a regular expression (as is used by R base function "sub") to match the file names.
    ##   replacement: replacement text for the new file name (as is used by R base function "gsub")
    ##   path: path to a directory containing the files to be renamed.  Default to the current directory.
    ## Return: Side Effect (all files in the directory will be renamed)
    ## Author: Feiming Chen, Date: 21 Apr 2017, 13:32
    ## ________________________________________________

    f1 <- dir(path, pattern, full.names = T, recursive = T) # Current file names. Include all files in subdirectories.
    f1.base <- basename(f1)
    f2.base <-  sub(pattern, replacement, f1.base)                   # Corresponding New file names
    f2 <- file.path(dirname(f1), f2.base)
    ans <- file.rename(f1, f2)
    idx <- which(!ans)                  # which operation (file renaming) fails
    if (length(idx) == 0) {
        cat("All", length(ans), "files are renamed.\n")
    } else {
        cat(length(idx), "out of", length(ans), "files are not renamed.\n")
    }
}
if (F) {                                # Unit Test
    dir.create("tmp")
    setwd("tmp")
    file.create("a.b.html", "c.d.html")
    batch.rename.file("\\.", "_")
    dir()                               # "a_b.html" "c_d.html"
}
Thursday, April 20, 2017
Abbreivate a binomial scientific name
abbreviate.species.names <- function(x)
{
    ## Purpose: Abbreivate a binomial scientific name.
    ## Arguments:
    ##   x: a vector of strings for the names of the species.
    ## Return: a vector of strings with the abbreviated names
    ## Author: Feiming Chen, Date: 20 Apr 2017, 14:01
    ## ________________________________________________

    x1 <- gsub(" +", " ", x)
    x2 <- sub("^ +", "", x1)
    x3 <- sub(" +$", "", x2)
    x4 <- strsplit(x3, " ")

    sapply(x4, function(y) {
        if (length(y) == 2) {
            ans <- paste0(toupper(substr(y[1], 1, 1)), ".", tolower(y[2]))
        } else ans <- y
        ans
    })
}
if (F) {                                # Unit Test
    x = c("Escherichia coli", "Tyrannosaurus rex", "N/A", " Canis   lupus  ")
    abbreviate.species.names(x)         # "E.coli"  "T.rex"   "N/A"     "C.lupus"
}
Tuesday, April 18, 2017
Extract a specific "pattern" from each element of a character vector
extract.pattern <- function(x, pattern = "([[:alnum:]]+)")
{
    ## Purpose: Extract a specific "pattern" from each element of a character vector.
    ## Arguments:
    ##   x: a character vector
    ##   pattern: a regular expression which specifies the pattern (inside brackets) to be extracted.
    ## Return: a vector with the extracted pattern.  NA is filled in where no match is found.
    ## Author: Feiming Chen, Date: 18 Apr 2017, 14:34
    ## ________________________________________________

    r <- paste0(".*", pattern, ".*")
    sub(r, "\\1", x)
}
if (F) {                                # Unit Test
    x = c(NA, "a-b", "a-d", "b-c", "d-e")
    extract.pattern(x)                  # extract alpha-numeric pattern
    ## [1] NA  "b" "d" "c" "e"

    x = c("ab(A)x", "dc(B)y")
    extract.pattern(x, "(\\(.*\\))")      # extract the string inside brackets
    ## [1] "(A)" "(B)"
    extract.pattern(x, "\\)(.*)")      # extract the string after ")"
    ## [1] "x" "y"

    x = c("V167.G56", "V166.R56", "V122.G41", "V163.R55", "V165.B55", "V175.R59")
    extract.pattern(x, "(R|G|B)")       # extract R or G or B character only.
    ## [1] "G" "R" "G" "R" "B" "R"
    extract.pattern(x, "[RGB]{1}([0-9]+)") # extract the numbers following the R, G, B character.
    ## [1] "56" "56" "41" "55" "55" "59"
}
Format a confusion matrix (removing zero entry for visual clarity)
format.confusion.matrix <- function(x)
{
    ## Purpose: Format a confusion matrix (removing zero entry for visual clarity)
    ##          Requires package "formattable".
    ## Arguments:
    ##    x: a confusion matrix (nrow = ncol, with counts in each cell)
    ## Return: a formated confusion matrix in html browser and in a CSV file.
    ## Author: Feiming Chen, Date: 17 Apr 2017, 15:45
    ## ________________________________________________

    x1 <- as.character(as.matrix(x))
    x1[x1 == "0"] <- ""
    x2 <- matrix(x1, nrow(x), ncol(x), dimnames=dimnames((x)))
    write.csv(x2, file="Confusion-Matrix.csv")
    formattable::formattable(as.data.frame(x2))
}
if (F) {                                # Unit Test
    x <- matrix(c(3,1,0,1,4,0,0,1,6), 3, 3, dimnames = list(c("A", "B", "C"), c("A", "B", "C")))
    format.confusion.matrix(x)
}

Sort a Data Frame
sort.df <-  function(d)
{
    ## Purpose: Sort a Data Frame along 1st column, ties along 2nd, ..., until its last column.
    ## Arguments:
    ##   d: a data frame
    ## Return: a sorted data frame
    ## Author: Feiming Chen, Date: 18 Apr 2017, 13:49
    ## ________________________________________________
    d[ do.call(order, d), ]
}
if (F) {                                # Unit Test
    df <- data.frame(X = c("b", "a", "a", "c"), Y = c(4, 2, 1, 3))
    sort.df(df)
    ##   X Y
    ## 3 a 1
    ## 2 a 2
    ## 1 b 4
    ## 4 c 3

    sort.df(df[2:1])
    ##   Y X
    ## 3 1 a
    ## 2 2 a
    ## 4 3 c
    ## 1 4 b
}
Thursday, April 13, 2017
Check if a vector's values are all the same
is.constant  <- function(x)
{
    ## Purpose: Check if a vector's values are all the same.
    ## Arguments:
    ##   x: a vector (numeric, character, logical, etc.)
    ## Return: a logical value tha is TRUE if and only if all the values are the same (constant).
    ## Author: Feiming Chen, Date: 13 Apr 2017, 14:59
    ## ________________________________________________
    y <- rep.int(x[1], length(x))
    isTRUE(all.equal(x, y))
}
if (F) {                                # Unit Test
    is.constant(c(T, T, F))             # F
    is.constant(c(F, F, F))             # T
    is.constant(c(1, 1, 2))             # F
    is.constant(c(2, 2, 2))             # T
    is.constant(c("a", "a", "b"))       # F
    is.constant(c("b", "b", "b"))       # T
}
Tuesday, April 11, 2017
Find the value that is the maximum in absolute value
my.abs.max <- function(x)
{
    ## Purpose: Find the value that is the maximum in absolute value
    ## Arguments:
    ##   x: a numeric vector
    ## Return:  a value in the "x" vector that is the largest in absolute value (keep the sign).
    ## Author: Feiming Chen, Date: 11 Apr 2017, 15:19
    ## ________________________________________________

    i <- which.max(abs(x))
    x[i]
}
if (F) {                                # Unit Test
    my.abs.max(c(1, -3, 2))             # -3
    my.abs.max(c(1, 3, -2))             # 3
}
Test Time Series Second Order Curvature Significance
test.ts.2nd.order.sig <- function(x, graph=F)
{
    ## Purpose: Test Time Series 2nd Order Significance.
    ## Arguments:
    ##    x: a numeric vector (time series)
    ## Return:  P-value for testing the 2nd order significance.
    ## Author: Feiming Chen, Date: 10 Apr 2017, 14:57
    ## ________________________________________________

    d <- data.frame(Response = x, Time = seq(x))
    m1 <- lm(Response ~ Time, d)
    m2 <- lm(Response ~ Time + I(Time^2), d)
    a <- anova(m1, m2)
    model.compare.P.value <- a[["Pr(>F)"]][2]

    if (graph) {
        plot(d$Time, d$Response, xlab="Time", ylab="Response", type="b")
        lines(d$Time, fitted(m1), col="red")
        lines(d$Time, fitted(m2), col="blue")
        title(main=paste("Model Comparison P-value =", round(model.compare.P.value, 3)))
    }

    model.compare.P.value
}
if (F) {                                # Unit Test
    x <- rnorm(100)
    test.ts.2nd.order.sig(x, graph = T)
    r <- replicate(10000, test.ts.2nd.order.sig(rnorm(20))) # should follow a uniform distribution.
    ## summary(r)
    ##    Min. 1st Qu.  Median    Mean 3rd Qu.    Max.
    ## 0.00011 0.25800 0.50600 0.50500 0.75500 1.00000
}

Wednesday, April 5, 2017
Convert RGB Color Value to Spherical Coordinates
rgb2sph <- function(rgb, nbits)
{
    ## Purpose: Convert RGB Color Value to Spherical Coordinates
    ## Arguments:
    ##   rgb: a (N X 3) matrix of RGB values (each row is a triplet of R, G, B).
    ##          Assume each integer value range from 0 to (2^nbits - 1).
    ##   nbits: number of bits used to code each of R, G, B channel.
    ## Return: a (N X 3) matrix of Shperical Coordinates (each row is a triplet of M, Theta, Phi), which are scaled to be within (0, 1).
    ## Author: Feiming Chen, Date:  5 Apr 2017, 10:21
    ## ________________________________________________

    max.scale <- 2^nbits
    M.scale <- sqrt(3 * max.scale^2)
    angle.scale <- pi / 2

    t(apply(rgb + 1, 1, function(x) {
        M <- sqrt(sum(x^2))             # Color Intensity/Luminosity (0-1)
        Theta <- atan(x[2] / x[1])      # Azimuthal Angle
        Phi <- acos(x[3] / M)           # Zenith Angle
        c(M / M.scale, Theta / angle.scale, Phi / angle.scale)
    }))
}
if (F) {                                # Unit Test
    rgb <- matrix(c(0, 0, 0,  4095,4095,4095, 3527, 3513, 3504, 2470, 3034,3218), ncol=3, byrow = T)
    rgb2sph(rgb, nbits = 12)
##            [,1]    [,2]    [,3]
## [1,] 0.00024414 0.50000 0.60817
## [2,] 1.00000000 0.50000 0.60817
## [3,] 0.85832017 0.49873 0.60954
## [4,] 0.71428036 0.56498 0.56181
}

Wednesday, February 15, 2017
Look up value in a reference table (Similar to Excel's VLOOKUP function)
vlookup <- function(x, x.vector, y.vector = seq(x.vector), exact = FALSE, na.action = FALSE)
{
    ## PURPOSE: Look up value in a reference table (Similar to Excel's VLOOKUP function)
    ## ARGUMENT:
    ##    x: a vector of Look Up Value (should not contain NA values)
    ##    x.vector: a vector where the "x" value can be located (approximately).
    ##    y.vector: a vector containing the return value that correponds the identified location in the "x.vector".
    ##              Default to the index to the x.vector.
    ##    exact: if T, the numeric values have to match exactly.
    ##    na.action: If T and if cannot find the lookup value, return the input value.
    ## RETURN: a scale value that corresponds to the "x" lookup value.
    ## DATE: 20 Oct 2016, 16:30
    ## -----------------------------------------------------

    ans <- NULL
    if (is.numeric(x)) {
        if (exact) {
            ans <- y.vector[match(x, x.vector)]
        } else {
            ans <- y.vector[match.approx(x, x.vector)]
        }
    } else if (is.character(x)) {
        ans <- y.vector[match(x, x.vector)]
    }

    if (na.action) {
        idx <- is.na(ans)
        ans[idx] <- x[idx]
    }
    ans
}
if (F) {                                # Unit Test
    vlookup(c(68.2, 73), c(54, 60, 68.1, 72, 80), LETTERS[1:5]) # "C" "D"
    vlookup(c(2, 3.1), 1:5)                                     # 2 3
    vlookup(c(2, 3.1), 1:5, exact = T)                          # 2 NA
    vlookup(c("C", "E"), LETTERS[1:5], LETTERS[11:15]) #  "M" "O"
    vlookup(c("C", "X"), LETTERS[1:5], LETTERS[11:15]) #  "M" NA
    vlookup(c("C", "X"), LETTERS[1:5], LETTERS[11:15], na.action = T) #  "M" "X"
}


match.approx <- function(x, y) {
    ## Purpose: Match Approximately for Numerical Data
    ## Arguments:
    ##   "x":  a vector of numeric values.
    ##   "y":  a vector of numeric values.
    ## RETURN:
    ##   The index in "y" that indicates the closest y value to each of "x" value.
    ## Author: Feiming Chen, Date: 15 Feb 2017, 10:41
    ## ________________________________________________

    sapply(x, function(x0) which.min(abs(x0 - y)))
}
if (F) {
  match.approx(c(4.2, 1.2, 15), 1:10)                #  4  1 10
}
Simple Principal Component Analysis
my.pca  <- function(dat.feature)
{
    ## Purpose: Principal Component Analysis
    ## Arguments:
    ##   dat.feature: a data feature matrix, where each column is a feature vector.
    ## Return: PCA plots and result.
    ## Author: Feiming Chen, Date: 15 Feb 2017, 09:59
    ## ________________________________________________
    p <- prcomp(dat.feature)
    plot(p, main = "Scree Plot", xlab = "Principal Components")
    dev.new()
    biplot(p)
    print(summary(p))
    invisible(p)
}
if (F) {                                # Unit Test
    d <- matrix(rnorm(1000), 20)
    my.pca(d)
}


Tuesday, February 14, 2017
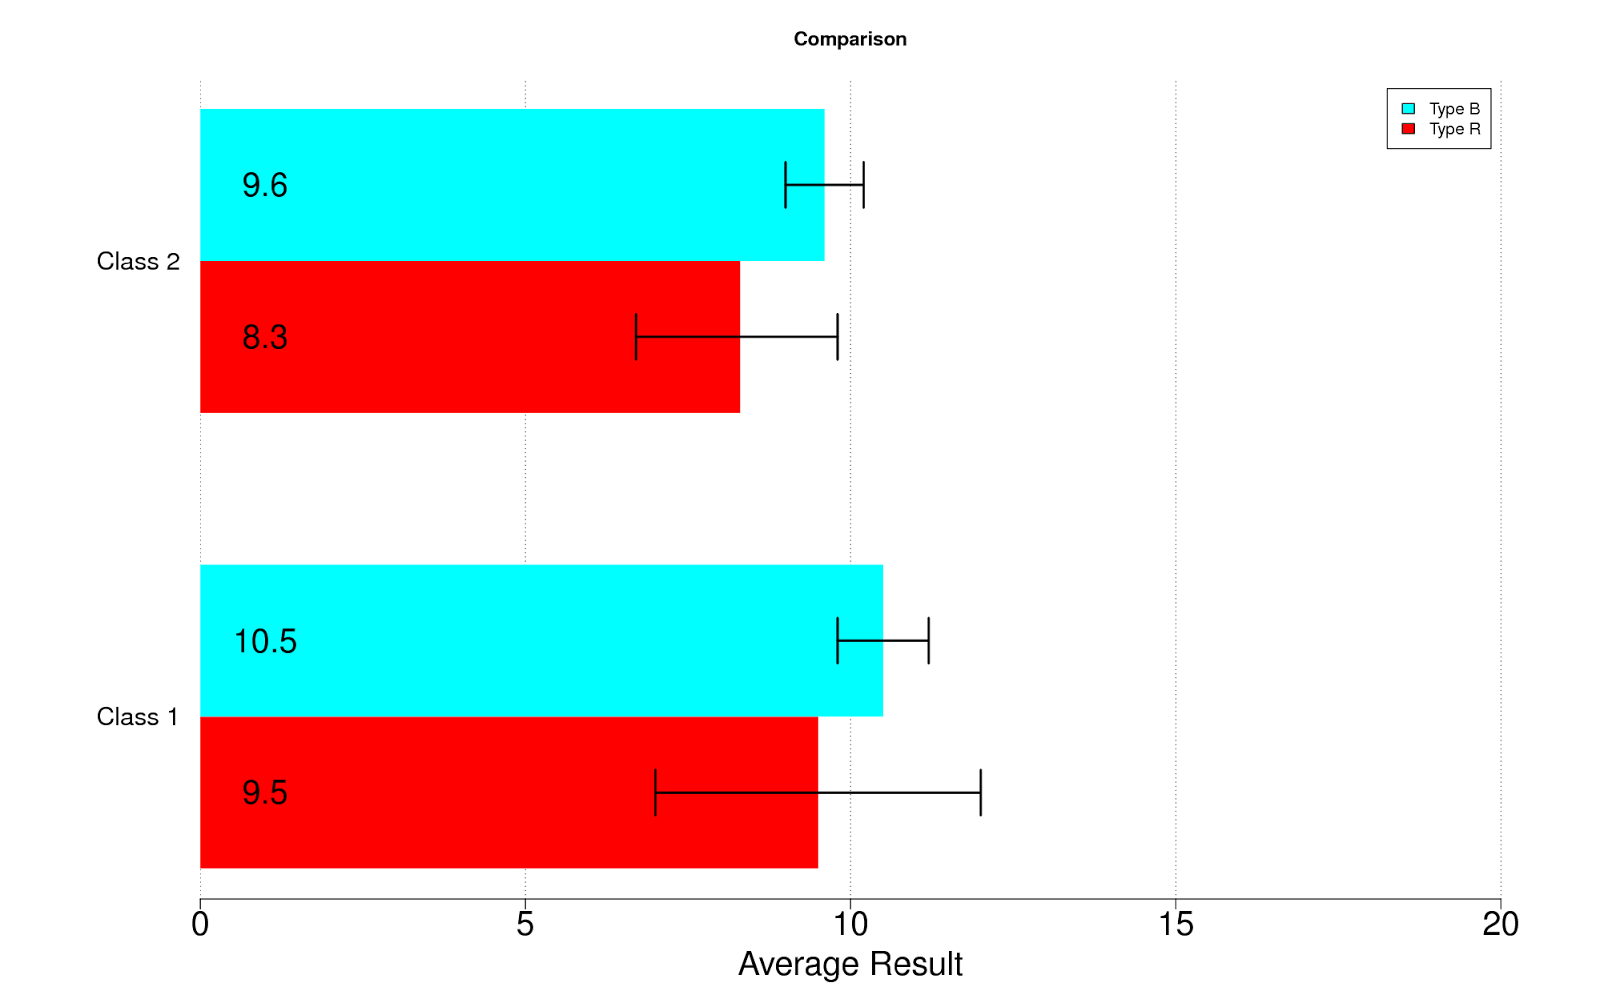
Making Barplot with Confidence Intervals
my.barplot  <- function(h, hl, hu, ...)
{
    ## Purpose: Template function for making Barplot with Confidence Interval.
    ##          Require R package "gplots". Refer to documentation of "gplots::barplots2".
    ## Arguments:
    ##   h: Height Matrix. Each column is a group of heights. The dimnames will be used for labeling.
    ##   hl: Lower CI. Same dimension as "h".
    ##   hu: Upper CI. Same dimension as "h".
    ##   ...: passed to "gplots::barplot2"
    ## Return:
    ## Author: Feiming Chen, Date: 14 Feb 2017, 14:22
    ## ________________________________________________

    old.par <- par("mar")
    par(mar = c(5, 10, 4, 5))
    gplots::barplot2(h, beside = T, legend.text = T, horiz = T, col=rainbow(ncol(h)), border = NA,
                     cex.axis = 2, cex.names = 1.5, cex.lab=2, las = 1, xpd = F,
                     plot.ci = TRUE, ci.l = hl, ci.u = hu, ci.width = 0.3, ci.lwd = 2,
                     plot.grid = TRUE,
                     ...) -> mp

    ## Put numbers on the bars
    for (i in seq(ncol(mp))) text(1, mp[,i], labels=round(h[,i], 2), cex=2)
    par(old.par)
}
if (F) {                                # Unit Test
    x <- structure(c(9.5, 10.5, 1.2, 0.4, 7, 12, 9.8, 11.2, 8.3, 9.6, 0.8, 0.3, 6.7, 9.8, 9, 10.2), .Dim = c(8L, 2L), .Dimnames = list(c("Type R", "Type B", "R.SD", "B.SD", "Rl", "Ru", "Bl", "Bu"), c("Class 1", "Class 2")))
    h <- x[1:2,]
    hl <- x[c(5,7),]
    hu <- x[c(6,8),]
    my.barplot(h, hl, hu, main="Comparison", xlab="Average Result", xlim = c(0, 20))
}
Generate HTML or PNG representation of a data / table / model object
tex.print <- function(x, type=c("PNG", "HTML"), file=NULL, caption = file, digits=0) {
    ## Purpose: Generate HTML or PNG representation of a data/table/model object.
    ##          Require R "memisc" package.
    ## Arguments:
    ##   x: an object (table, ftable, data frame, model object, etc. that are acceptable in R "memisc" package.
    ##   type: what to generate --
    ##         "HTML" shows a HTML table in a web browser.
    ##         "PNG" shows a PNG (image) file (require linux commands: latex, dvipng, display).
    ##   file: make a copy of the PNG file with this name.  Also used for the table name.
    ##   caption: table caption.
    ##   digits: number of decimal places to use.
    ## Return: Display the data representation and an image file (type="PNG") for insertion.
    ## Author: Feiming Chen, Date: 14 Feb 2017, 11:59
    ## ________________________________________________

    type <- match.arg(type)

    is.tabular.data <- "tabular" %in% class(x) # "x" is from the "tables" package output
    is.tbl.data <- "tbl" %in% class(x)         # "x" is from the "dplyr" package output

    if (is.tbl.data) {
        x <- as.data.frame(x)
    }

    switch(type,
           HTML = {
               ## Show HTML table in a Web Browser
               if (is.null(file)) {
                   memisc::show_html(x, digits = digits)
               } else {
                   memisc::write_html(x, file = paste0(file,".html"), digits = digits)
               }
           },
           PNG = {
               ## Generate LaTeX and PNG Image file

               if (is.tabular.data) {
                   library(tables)
                   booktabs()
               }

               if (is.tabular.data || is.tbl.data) {

                   w <- Hmisc::latex(x, file="X.tex", ctable=TRUE, caption = caption, digits = digits)
                   if (is.tabular.data) w$style <- c("booktabs", "dcolumn")
                   d <- Hmisc::dvi(w)                         # convert to DVI file
                   system(paste("dvipng -q* -o X.png -T tight -D 200", d$file)) # convert to PNG file with Tight box and Resolution of 200
                   file.remove("X.tex")

               } else {

                   r <- memisc:::toLatex.default(x, digits=digits, show.vars=TRUE)

                   f <- file("X.tex", "w")
                   writeLines(c("\\documentclass{article}",
                                "\\usepackage{booktabs}",
                                "\\usepackage{dcolumn}",
                                "\\begin{document}",
                                "\\pagenumbering{gobble}",
                                "\\begin{table}",
                                "\\centering"),  f)

                   if (!is.null(caption)) writeLines(paste0("\\caption{", caption, "}"), f)

                   writeLines(r, f)

                   writeLines(c("\\end{table}", "\\end{document}"), f)

                   close(f)

                   system("latex X.tex >/dev/null") # Generate DVI file from LaTeX file (X.tex -=> X.dvi)
                   system("dvipng -q* -o X.png -T tight -D 200 X.dvi >/dev/null") # convert to PNG file with Tight box and Resolution of 200
                   file.remove("X.tex", "X.log", "X.aux", "X.dvi")
               }

               if (is.null(file)) {
                   if (!grepl("/tmp", getwd())) {
                       file.copy("X.png", "~/tmp/X.png", overwrite = T)
                   }
                   system("display ~/tmp/X.png &")                                     # display the PNG file.
               } else {
                   file.rename("X.png", paste0(file,".png"))
               }
           }
           )
    invisible(NULL)
}
if (F) {                                # Unit Test
    x <- data.frame(age=c(1,1,1,5,5,5), height=c(10,12,9,20,23,18))
    tex.print(x)
    tex.print(ftable(x))
    x %>% group_by(age) %>% summarise(heights = mean(height)) -> y
    tex.print(y)
    tex.print(x, file="Test")
    tex.print(y, type="HTML")
    tex.print(y, type="HTML", file = "Test")

    library(tables)
    a <- tabular( (Species + 1) ~ (n=1) + Format(digits=2) * (Sepal.Length + Sepal.Width) * (mean + sd), data=iris )
    tex.print(a)
    tex.print(a, file = "test")

}


Apply a function to a vector in an accumulative manner (like cumsum)
cum.func <- function(x, func, ...)
{
    ## Purpose: Apply a function to a vector in an accumulative manner (like cumsum)
    ## Arguments:
    ##   x: a vector
    ##   func: a function
    ##   ...: passed to "func"
    ## Return: a vector that is the result of:
    ##   c( func(x[1]),  func(x[1:2]),  func(x[1:3]),  func(x[1:4]),  func(x[1:5]), ... )
    ## Author: Feiming Chen, Date: 30 Jan 2017, 14:06
    ## ________________________________________________

    N <- length(x)
    y <- rep_len(NA, N)
    for (i in 1:N) y[i] <- func(x[1:i], ...)
    y[is.na(x)] <- NA
    y
}
if (F) {                                # Unit Test
    cum.func(5:1, mean)                 #  c(5.0, 4.5, 4.0, 3.5, 3.0))
    cum.func(c(NA, 5:1, NA), mean, na.rm=T)                 #  c(NA, 5.0, 4.5, 4.0, 3.5, 3.0, NA)
    cum.func(c(NA, 5:1, NA), sd, na.rm=T)        # NA NA 0.70711 1.00000 1.29099 1.58114 NA
}
Overlay a new plot on an existing plot
plot.overlay <- function(..., label="2nd Y", col="blue")
{
    ## Purpose: Overlay a new plot on an existing plot.
    ## Arguments:
    ##   ...: Passed to the "plot" function for the new plot.
    ##   label: The secondary Y-axis label.
    ##   col: The color of the ticks and tick labels for the new plot.
    ## Return: A modified plot.
    ## Author: Feiming Chen, Date:  6 Feb 2017, 10:19
    ## ________________________________________________

    par(new=T)
    plot(..., axes=F, xlab="", ylab="", col=col)
    axis(side=4, col.ticks = col, col.axis=col)
    mtext(label, side=4, line=-1, col=col)
}
if (F) {                                # Unit Test
    plot(rnorm(100))
    plot.overlay(rnorm(100), type="l", label="Test")
}

Apply a function to each consecutive pairs in a vector.
diff.func <- function(x, func)
{
    ## Purpose: Apply a function to each consecutive pairs in a vector.
    ## Arguments:
    ##   x: a vector
    ##   func: a function that operature on two elements (of "x")
    ## Return: a vector, whose length is length(x) - 1, that looks like (where N=length(x))
    ##    func(x[2], x[1]), func(x[3], x[2]), func(x[4], x[3]), ..., func(x[N], x[N-1]).
    ## Author: Feiming Chen, Date:  9 Feb 2017, 11:25
    ## ________________________________________________

    ## embed in 2-dim space to make consecutive pairs
    x2 <- embed(x, 2)                  # N - 1 pairs
    ## apply a function to each consecutive paris (reversely)
    x3 <- apply(x2, 1, func)
    x3
}
if (F) {                                # Unit Test
    diff.func(1:5, diff)                # -1 -1 -1 -1
    diff.func(1:5, mean)                # 1.5 2.5 3.5 4.5
}
Plot multiple lines together using "matplot"
my.line.plot  <- function(x, y, ...)
{
    ## Purpose: Template function for making lines by group.
    ## Arguments:
    ##   x: X-coords
    ##   y: a matrix with Y-coords (each column has a set of Y values)
    ##   ...: passed to "plot"
    ## Return: A plot assuming log X-axis with axes tickes given by "x".
    ## Author: Feiming Chen, Date:  9 Feb 2017, 14:02
    ## ________________________________________________n
    N <- ncol(y)                        # number of lines
    matplot(x, y, type="b", log="x", xaxt="n", lwd=2, lty=seq(N), col = rainbow(N), ...)
    matpoints(x, y, log="x", xaxt="n", col = "black", ...)
    axis(1, at=x)
}
if (F) {                                # Unit Test
    x <- c(0.1, 1, 10)
    y <- matrix(rnorm(9), 3)
    my.line.plot(x, y, xlab="Tiime", ylab="Signal", main="Line Plot by Groups")
}

Monday, February 6, 2017
R Code: Apply a function to each element of a list (or data frame) or to each element of a list within a list of data while retaining the names attribute of each nested list
lf.compute.data.column <- function(dat.list, func, ...)
{
    ## Purpose: Apply a function to each column of a list (e.g. data frame). Retains the names information.
    ##          Basis for processing more complex data (e.g. a list of a list)
    ## Arguments:
    ##     dat.list: a list of data (e.g. data frame)
    ##     func: a function that computes a vector (may have an argument "name")
    ##     ...: passed to "func"
    ## Return:
    ##    a list of outputs.
    ## Author: Feiming Chen, Date: 30 Jan 2017, 13:21
    ## ________________________________________________

    this.name <- null2na(names(dat.list))

    mapply(func,
           dat.list,
           name = this.name,
           ...,
           SIMPLIFY = FALSE
           )
}
if (F) {                                # Unit Test
    dat.list = data.frame(x=rnorm(10), y=rnorm(10))
    lf.compute.data.column(dat.list, mean)
    lf.compute.data.column(dat.list, function(x, ...) { c(a=mean(x), b=sd(x)) })
    lf.compute.data.column(dat.list, function(x, name) { list(a=mean(x), n=name) })
}


lf.compute.data.column.2 <- function(dat.list, func, ...)
{
    ## Purpose: Apply a function to a list of a list of data. Retains the names information.
    ## Arguments:
    ##   dat.list: a list of a list
    ##   func: a function that computes a vector.  (may have an argument "name")
    ## Return: a list of list of results
    ## Author: Feiming Chen, Date:  6 Feb 2017, 12:50
    ## ________________________________________________

    this.name <- null2na(names(dat.list))

    mapply(
        function(d, name) {
            if (!is.na(name)) names(d) <- paste0(name, ".", names(d))
            lf.compute.data.column(d, func)
        },
        dat.list,
        name = this.name,
        ...,
        SIMPLIFY = FALSE
    )
}
if (F) {                                # Unit Test
    dat.list.2 = list(test1 = data.frame(x=1:5, y=6:10), test2= data.frame(x=11:15, y=16:20))
    lf.compute.data.column.2(dat.list.2, mean)
    lf.compute.data.column.2(dat.list.2, function(x, ...) { c(m=mean(x), s=sd(x)) })
    lf.compute.data.column.2(dat.list.2, function(x, name) { list(m=mean(x), n=name) })
}
null2na <- function(x) {
    ## if the value of x is NULL(as determined by length test since is.null may
    ## not always work), turn it into NA so that an object
    ## made of it will always exist.
    if (length(x)==0)
        x <- NA
    x
}
R Code: Extract a fixed component of a list within a list and optionally apply a function
lf <- function(obj, comp, fun=identity, wrap=identity,
               return.vector=TRUE, verbose=FALSE,
               ...) {
    ## WARNING: "comp" have to be a real string instead of a variable
    ## Functional Apply
    ## "comp": a character string, indicated a list component.
    ## "obj" is a list. "comp" is a component of each element of the
    ## list "obj".  Apply a funcion (just an unquoted name) to each "comp" of the list
    ## "obj".  "..." is passed to "fun".  use "fun=identity" if no
    ## processing is needed.  "wrap" is applied to the final result.
    ## "return.vector" will force the result to be a vector.

    comp <- substitute(comp)
    e <- paste(deparse(substitute(wrap)), "(lapply(obj,",
               deparse(substitute(function(x) fun(x[[comp]], ...))), "))")
    ans <- eval(parse(text=e))
    if (verbose) cat("expression:", e, "\n")
    if (return.vector)
        ans <- sapply(ans, function(x) if (is.null(x)) NA else x)

    ans
}
if (F) {
    a <- list(x=c(1:3), y=c(4:6))
    lf(a, 2)                            # c(x=2, y=5)

    a <- list(x=list(median=3, mean=4), y=list(median=5, mean=6))
    lf(a, "mean")                       # c(x=4, y=6)
    lf(a, "mean", sqrt, verbose=T)               # c(x=2, y=2.4495)
    lf(a, "mean", sqrt, wrap=length, verbose=T)  # 2
}
R Code: Apply a function to a vector in an accumulative manner
cum.func <- function(x, func)
{
    ## Purpose: Apply a function to a vector in an accumulative manner (like cumsum)
    ## Arguments:
    ##   x: a vector
    ##   func: a function
    ## Return: a vector that is the result of:
    ##   c( func(x[1]),  func(x[1:2]),  func(x[1:3]),  func(x[1:4]),  func(x[1:5]), ... )
    ## Author: Feiming Chen, Date: 30 Jan 2017, 14:06
    ## ________________________________________________

    N <- length(x)
    y <- rep_len(NA, N)
    for (i in 1:N) y[i] <- func(x[1:i])
    y
}
if (F) {                                # Unit Test
    identical(cum.func(5:1, mean),  c(5.0, 4.5, 4.0, 3.5, 3.0))
}
R Function for Overlaying a New Plot on an Existing Plot
plot.overlay <- function(..., label="2nd Y", col="blue")
{
    ## Purpose: Overlay a new plot on an existing plot.
    ## Arguments:
    ##   ...: Passed to the "plot" function for the new plot.
    ##   label: The secondary Y-axis label.
    ##   col: The color of the ticks and tick labels for the new plot.
    ## Return: A modified plot.
    ## Author: Feiming Chen, Date:  6 Feb 2017, 10:19
    ## ________________________________________________

    par(new=T)
    plot(..., axes=F, xlab="", ylab="", col=col)
    axis(side=4, col.ticks = col, col.axis=col)
    mtext(label, side=4, line=-1, col=col)
}
if (F) {                                # Unit Test
    plot(rnorm(100))
    plot.overlay(rnorm(100), type="l", label="Test")
}
Subscribe to:
Posts (Atom)