Tuesday, April 25, 2017

Apply a stamp (text string) to each page of a PDF file

my.pdf.stamp <- function(stamp.text="Stamp", pos=c(0.4, 0.9), pdf.in.file,  pdf.out.file)
{ 
    ## Purpose: Apply a stamp (text string) to each page of a PDF file.
    ##          Requires Linux program "pdftk". 
    ## Arguments:
    ##   pdf.in.file: Input PDF file. 
    ##   stamp.text: a vector of strings (stamps). Each value will be stamped on the corresponding page of the PDF file.
    ##               Its values will be recycled to match the total number of pages in the input PDF file.
    ##   pos: position of the stamp text (located between [0,1] X [0,1])
    ##   pdf.out.file: Output PDF file with the stamps. 
    ## Return: PDF file with the stamps. 
    ## Author: Feiming Chen, Date: 25 Apr 2017, 10:42
    ## ________________________________________________
    
    p1 <- pdf.file.page.number(pdf.in.file)
    p2 <- length(stamp.text)
    if (p1 != p2) stamp.text <- rep(stamp.text, length.out = p1)

    ## burst the PDF file into single page PDF's
    f <- "page_%05d.pdf"
    fs <- "stamp_%05d"
    fs2 <- "stamp_%05d-Plot.pdf"
    fo <- "out_%05d.pdf"
    system(paste("pdftk", pdf.in.file, "burst output", f))
    
    for (i in 1:p1) {
        X(text.in.plot(stamp.text[i], cex = 2, pos = pos), file =  sprintf(fs, i), open.pdf=F)
        system(paste("pdftk", sprintf(f, i), "stamp", sprintf(fs2, i), "output", sprintf(fo, i)))
    }

    merge.file.list <- paste(sapply(1:p1, function(i) sprintf(fo, i)), collapse = " ")

    system(paste("pdftk", merge.file.list, "cat output", pdf.out.file))
}
if (F) {                                # Unit Test
    dir.create("tmp"); setwd("tmp")
    pdf("test.pdf"); replicate(3, plot(rnorm(100))); dev.off()

    pdf.in.file <- "test.pdf"
    pdf.out.file <- "result.pdf"
    stamp.text <- LETTERS[1:3]
    pos <- c(0.4, 0.9)

    my.pdf.stamp(stamp.text, pos=pos, pdf.in.file,  pdf.out.file)
}
pdf.file.page.number <- function(fname) {
    ## Return the total number of pages in a PDF file.
    ## Require Linux program "pdfinfo"
    a <- pipe(paste0("pdfinfo '", fname, "' | grep Pages | cut -d: -f2"))
    page.number <- as.numeric(readLines(a))
    close(a)
    page.number
}
if (F) {
    ## pdf.file.page.number("ALL-Plots.pdf")
}
text.in.plot <- function(x, cex=1, pos=c(0.5, 0.5)) {
    ## "x" is a string.  Put "x" in the center of a plot.  For putting
    ## text summary in a PDF file that is mostly plots.
    ## "pos" is the position of the text string
    ## "cex" is the expansion ratio of the text string
  plot(c(0, 1), c(0, 1), type = "n", main = "", xlab = "", ylab = "", xaxt="n", yaxt="n", axes = F, mar=c(0,0,0,0), oma=c(0,0,0,0))
  text(pos[1], pos[2], x, cex=cex)
}
if (F) {
    text.in.plot("good", cex=5)
    text.in.plot("bad", pos=c(0.1, 0.1))
}
X <- function(expr, file="test", open.pdf = TRUE) {
    ## USED IN UNIX!
    ## Generate a PDF file based on evaluation of expr and open it
    ## Put multiple plot commands like "{ cmd1; cmd2; cmd3; cmd4 }".  
    ## USAGE: xpdf(plot(sig1))
    graphics.off()
    ## png("~/tmp/plot.png", width=600, height=600)
    r <- my.pdf(file)
    ans <- eval(expr)
    dev.off()
    ## system("convert ~/tmp/plot.pdf ~/tmp/plot.png")
    if (open.pdf) open.pdf(r$plot)
    invisible(ans)
}
if (F) {
    X(plot(rnorm(100)))
    a <- X({plot(a <- rnorm(100)); a})
    X({plot(a <- rnorm(100)); hist(a); boxplot(a); dotchart(a); qqnorm(a); plot(lm(a~seq(a)))})
}
open.pdf <- function(file) {
    ## Open a PDF file.
    system(paste("evince ", file, " &", sep=""))
    cat("See Plot In: ", file, "\n")
}

Return the total number of pages in a PDF file.

pdf.file.page.number <- function(fname) {
    ## Return the total number of pages in a PDF file.
    ## Require Linux program "pdfinfo"
    a <- pipe(paste0("pdfinfo '", fname, "' | grep Pages | cut -d: -f2"))
    page.number <- as.numeric(readLines(a))
    close(a)
    page.number
}
if (F) {
    ## pdf.file.page.number("ALL-Plots.pdf")
}

Friday, April 21, 2017

Rename all files in a directory according to a pattern (regular expression)

batch.rename.file <- function(pattern, replacement, path=".")
{ 
    ## Purpose: Rename all files in a directory according to a pattern (regular expression). 
    ## Arguments:
    ##   pattern: a regular expression (as is used by R base function "sub") to match the file names. 
    ##   replacement: replacement text for the new file name (as is used by R base function "gsub")
    ##   path: path to a directory containing the files to be renamed.  Default to the current directory. 
    ## Return: Side Effect (all files in the directory will be renamed)
    ## Author: Feiming Chen, Date: 21 Apr 2017, 13:32
    ## ________________________________________________
    
    f1 <- dir(path, pattern, full.names = T, recursive = T) # Current file names. Include all files in subdirectories. 
    f1.base <- basename(f1)
    f2.base <-  sub(pattern, replacement, f1.base)                   # Corresponding New file names
    f2 <- file.path(dirname(f1), f2.base)
    ans <- file.rename(f1, f2)
    idx <- which(!ans)                  # which operation (file renaming) fails
    if (length(idx) == 0) {
        cat("All", length(ans), "files are renamed.\n")
    } else {
        cat(length(idx), "out of", length(ans), "files are not renamed.\n")
    }
}
if (F) {                                # Unit Test
    dir.create("tmp")
    setwd("tmp")
    file.create("a.b.html", "c.d.html")
    batch.rename.file("\\.", "_")
    dir()                               # "a_b.html" "c_d.html"
}

Thursday, April 20, 2017

Abbreivate a binomial scientific name

abbreviate.species.names <- function(x)
{ 
    ## Purpose: Abbreivate a binomial scientific name. 
    ## Arguments:
    ##   x: a vector of strings for the names of the species. 
    ## Return: a vector of strings with the abbreviated names
    ## Author: Feiming Chen, Date: 20 Apr 2017, 14:01
    ## ________________________________________________

    x1 <- gsub(" +", " ", x)
    x2 <- sub("^ +", "", x1)
    x3 <- sub(" +$", "", x2)
    x4 <- strsplit(x3, " ")

    sapply(x4, function(y) {
        if (length(y) == 2) {
            ans <- paste0(toupper(substr(y[1], 1, 1)), ".", tolower(y[2]))
        } else ans <- y
        ans
    })
}
if (F) {                                # Unit Test
    x = c("Escherichia coli", "Tyrannosaurus rex", "N/A", " Canis   lupus  ")
    abbreviate.species.names(x)         # "E.coli"  "T.rex"   "N/A"     "C.lupus"
}

Tuesday, April 18, 2017

Extract a specific "pattern" from each element of a character vector

extract.pattern <- function(x, pattern = "([[:alnum:]]+)")
{ 
    ## Purpose: Extract a specific "pattern" from each element of a character vector.
    ## Arguments:
    ##   x: a character vector
    ##   pattern: a regular expression which specifies the pattern (inside brackets) to be extracted. 
    ## Return: a vector with the extracted pattern.  NA is filled in where no match is found. 
    ## Author: Feiming Chen, Date: 18 Apr 2017, 14:34
    ## ________________________________________________

    r <- paste0(".*", pattern, ".*")
    sub(r, "\\1", x)
}
if (F) {                                # Unit Test
    x = c(NA, "a-b", "a-d", "b-c", "d-e")
    extract.pattern(x)                  # extract alpha-numeric pattern
    ## [1] NA  "b" "d" "c" "e"

    x = c("ab(A)x", "dc(B)y")
    extract.pattern(x, "(\\(.*\\))")      # extract the string inside brackets
    ## [1] "(A)" "(B)"
    extract.pattern(x, "\\)(.*)")      # extract the string after ")"
    ## [1] "x" "y"

    x = c("V167.G56", "V166.R56", "V122.G41", "V163.R55", "V165.B55", "V175.R59")
    extract.pattern(x, "(R|G|B)")       # extract R or G or B character only. 
    ## [1] "G" "R" "G" "R" "B" "R"
    extract.pattern(x, "[RGB]{1}([0-9]+)") # extract the numbers following the R, G, B character. 
    ## [1] "56" "56" "41" "55" "55" "59"
}

Format a confusion matrix (removing zero entry for visual clarity)


format.confusion.matrix <- function(x)
{ 
    ## Purpose: Format a confusion matrix (removing zero entry for visual clarity)
    ##          Requires package "formattable". 
    ## Arguments:
    ##    x: a confusion matrix (nrow = ncol, with counts in each cell) 
    ## Return: a formated confusion matrix in html browser and in a CSV file. 
    ## Author: Feiming Chen, Date: 17 Apr 2017, 15:45
    ## ________________________________________________

    x1 <- as.character(as.matrix(x))
    x1[x1 == "0"] <- ""
    x2 <- matrix(x1, nrow(x), ncol(x), dimnames=dimnames((x)))
    write.csv(x2, file="Confusion-Matrix.csv")
    formattable::formattable(as.data.frame(x2))
}
if (F) {                                # Unit Test
    x <- matrix(c(3,1,0,1,4,0,0,1,6), 3, 3, dimnames = list(c("A", "B", "C"), c("A", "B", "C")))
    format.confusion.matrix(x)
}

Sort a Data Frame

sort.df <-  function(d)
{ 
    ## Purpose: Sort a Data Frame along 1st column, ties along 2nd, ..., until its last column. 
    ## Arguments:
    ##   d: a data frame
    ## Return: a sorted data frame
    ## Author: Feiming Chen, Date: 18 Apr 2017, 13:49
    ## ________________________________________________
    d[ do.call(order, d), ]    
}
if (F) {                                # Unit Test
    df <- data.frame(X = c("b", "a", "a", "c"), Y = c(4, 2, 1, 3))
    sort.df(df)
    ##   X Y
    ## 3 a 1
    ## 2 a 2
    ## 1 b 4
    ## 4 c 3

    sort.df(df[2:1])
    ##   Y X
    ## 3 1 a
    ## 2 2 a
    ## 4 3 c
    ## 1 4 b
}

Thursday, April 13, 2017

Check if a vector's values are all the same

is.constant  <- function(x)
{ 
    ## Purpose: Check if a vector's values are all the same. 
    ## Arguments:
    ##   x: a vector (numeric, character, logical, etc.)
    ## Return: a logical value tha is TRUE if and only if all the values are the same (constant). 
    ## Author: Feiming Chen, Date: 13 Apr 2017, 14:59
    ## ________________________________________________
    y <- rep.int(x[1], length(x))
    isTRUE(all.equal(x, y))
}
if (F) {                                # Unit Test
    is.constant(c(T, T, F))             # F
    is.constant(c(F, F, F))             # T
    is.constant(c(1, 1, 2))             # F
    is.constant(c(2, 2, 2))             # T
    is.constant(c("a", "a", "b"))       # F
    is.constant(c("b", "b", "b"))       # T
}

Tuesday, April 11, 2017

Find the value that is the maximum in absolute value

my.abs.max <- function(x)
{ 
    ## Purpose: Find the value that is the maximum in absolute value
    ## Arguments:
    ##   x: a numeric vector
    ## Return:  a value in the "x" vector that is the largest in absolute value (keep the sign). 
    ## Author: Feiming Chen, Date: 11 Apr 2017, 15:19
    ## ________________________________________________

    i <- which.max(abs(x))
    x[i]
}
if (F) {                                # Unit Test
    my.abs.max(c(1, -3, 2))             # -3
    my.abs.max(c(1, 3, -2))             # 3
}

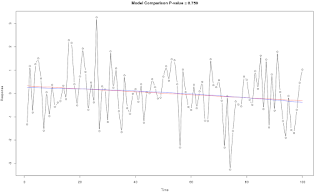
Test Time Series Second Order Curvature Significance


test.ts.2nd.order.sig <- function(x, graph=F)
{ 
    ## Purpose: Test Time Series 2nd Order Significance. 
    ## Arguments:
    ##    x: a numeric vector (time series)
    ## Return:  P-value for testing the 2nd order significance. 
    ## Author: Feiming Chen, Date: 10 Apr 2017, 14:57
    ## ________________________________________________

    d <- data.frame(Response = x, Time = seq(x))
    m1 <- lm(Response ~ Time, d)
    m2 <- lm(Response ~ Time + I(Time^2), d)
    a <- anova(m1, m2)
    model.compare.P.value <- a[["Pr(>F)"]][2]
    
    if (graph) {
        plot(d$Time, d$Response, xlab="Time", ylab="Response", type="b")
        lines(d$Time, fitted(m1), col="red")
        lines(d$Time, fitted(m2), col="blue")
        title(main=paste("Model Comparison P-value =", round(model.compare.P.value, 3)))
    }

    model.compare.P.value
}
if (F) {                                # Unit Test
    x <- rnorm(100)
    test.ts.2nd.order.sig(x, graph = T)
    r <- replicate(10000, test.ts.2nd.order.sig(rnorm(20))) # should follow a uniform distribution. 
    ## summary(r)
    ##    Min. 1st Qu.  Median    Mean 3rd Qu.    Max. 
    ## 0.00011 0.25800 0.50600 0.50500 0.75500 1.00000 
}

Wednesday, April 5, 2017

Convert RGB Color Value to Spherical Coordinates


rgb2sph <- function(rgb, nbits)
{ 
    ## Purpose: Convert RGB Color Value to Spherical Coordinates
    ## Arguments:
    ##   rgb: a (N X 3) matrix of RGB values (each row is a triplet of R, G, B).
    ##          Assume each integer value range from 0 to (2^nbits - 1).
    ##   nbits: number of bits used to code each of R, G, B channel. 
    ## Return: a (N X 3) matrix of Shperical Coordinates (each row is a triplet of M, Theta, Phi), which are scaled to be within (0, 1).
    ## Author: Feiming Chen, Date:  5 Apr 2017, 10:21
    ## ________________________________________________
    
    max.scale <- 2^nbits
    M.scale <- sqrt(3 * max.scale^2)  
    angle.scale <- pi / 2

    t(apply(rgb + 1, 1, function(x) {
        M <- sqrt(sum(x^2))             # Color Intensity/Luminosity (0-1) 
        Theta <- atan(x[2] / x[1])      # Azimuthal Angle
        Phi <- acos(x[3] / M)           # Zenith Angle 
        c(M / M.scale, Theta / angle.scale, Phi / angle.scale)
    }))
}
if (F) {                                # Unit Test
    rgb <- matrix(c(0, 0, 0,  4095,4095,4095, 3527, 3513, 3504, 2470, 3034,3218), ncol=3, byrow = T)
    rgb2sph(rgb, nbits = 12)
##            [,1]    [,2]    [,3]
## [1,] 0.00024414 0.50000 0.60817
## [2,] 1.00000000 0.50000 0.60817
## [3,] 0.85832017 0.49873 0.60954
## [4,] 0.71428036 0.56498 0.56181
}