feature.filtering.ns <- function(X, df = 10, graph = FALSE)
{
    ## Purpose: Feature Filtering with Natural B-Splines for Functional Modeling Application.
    ##          Preprocess the feature data (design matrix) to enforce a natural regularization.
    ##          In other words, project each observation to each of "df" axis represented by B-spline Basis.
    ## Arguments:
    ##   X: a design matrix (predictors) of dimension N x p (N observations, p predictors).
    ##      If "X" is a vector, convert it to a matrix with one row.
    ##   df: Degrees of Freedom (number of natural B-splines basis functions to approximate the (continuous) coefficient function.
    ##       Beta (p x 1) = H (p x df) Theta (df x 1), where H represents "df" number of continuous basis functions
    ##       in the coefficient space, and Theta represents the linear combination parameters for constructing Beta.
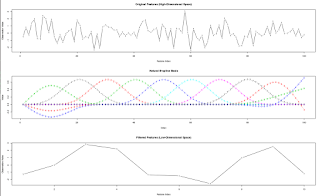
    ##   graph: if TRUE, plot each observation (each row of X) as a time series,
    ##          its projection to the reduced space (formed by the natural B-spline basis),
    ##          and the natural B-spline basis.
    ## Return: Preprocessed Features (X H) of dimension N x df, which can be used as "df" input into a predictive model.
    ##         X Beta = X H Theta = (X H) Theta
    ## Author: Feiming Chen, Date:  3 May 2017, 12:12
    ## ________________________________________________

    if (is.vector(X)) X <- matrix(X, nrow = 1)

    p <- ncol(X)                        # number of predictors
    require(splines)
    ## B-splines for Natural Cubic Spline: a p x df  matrix.
    H <- ns(1:p, df=df)

    ## Filtered Features.  Dimensions: N x p  p x df = N x df
    ## Project each observation "x" into one of "df" Basis (each column of H matrix) so that
    ## each "x" is represented by "df" coefficient (coordinates in the coordinate system defined by "H")
    ans <- X %*% H

    if (graph) {
        par(mfrow=c(3,1))
        matplot(t(X), type = "b", xlab = "Feature Index", ylab = "Observation Value",
                main = "Original Features (High-Dimensional Space)")
        matplot(H, type="b", xlab = "Index", ylab ="Value", main="Natural B-spline Basis")
        matplot(t(ans), type = "b", xlab = "Feature Index", ylab = "Observation Value",
                main = "Filtered Features (Low-Dimensional Space)")
        par(mfrow=c(1,1))
    }

    ans
}
if (F) {                                # Unit Test
    X <- matrix(rnorm(1000), 20, 50)
    y <- feature.filtering.ns(X)
    y <- feature.filtering.ns(X, df = 20)

    x <- rnorm(100)
    y <- feature.filtering.ns(x, graph=T)
}

