Span <- function(f, x)
{
    ## Purpose: A Predicate Functional that finds the location of the longest sequential run
    ##          of elements where the predicate is true.
    ## Arguments:
    ##   f: a predicate (a function that returns a single TRUE or FALSE)
    ##   x: a list or data frame
    ## Return: The location of the longest sequential run of elements where the predicate is true.
    ## Author: Feiming Chen, Date: 28 Jun 2017, 09:45
    ## ________________________________________________

    y <- rle(Where(f, x))
    z <- y$lengths
    w <- which.max(z)          # position of the segment with longest sequential run of TRUE
    pos.end <- sum(z[1:w])
    pos.start <- pos.end - z[w] + 1
    c(start=pos.start, end=pos.end)
}
if (F) {                                # Unit Test
    x <- c(3, 1, NA, 4, NA, NA, NA, 5, 9, NA, NA)
    Span(is.na, x)
    ## start   end
    ##     5     7
}

Where <- function(f, x)
{
    ## Purpose: A Predicate Functional
    ## See other Predicate Functionals: Filter(), Find(), Position()
    ## See other Functionals: Map(), Reduce()
    ## Arguments:
    ##   f: a predicate (a function that returns a single TRUE or FALSE) (e.g. is.character, all, is.NULL)
    ##   x: a list or data frame
    ## Return: a logical vector
    ## Author: Feiming Chen, Date: 28 Jun 2017, 09:45
    ## ________________________________________________

    vapply(x, f, logical(1))
}
if (F) {                                # Unit Test
    df <- data.frame(x = 1:3, y = c("a", "b", "c"), stringsAsFactors = T)
    Where(is.factor, df)
    ## Compare with:
    Filter(is.factor, df)
    Find(is.factor, df)
    Position(is.factor, df)
}
Wednesday, June 28, 2017
Span: A Predicate Functional that finds the location of the longest sequential run of elements where the predicate is true
Thursday, June 22, 2017
Draw a data frame as a R plot
my.table.plot0 <- function(x,
                           highlight.matrix = NULL,
                           main = "Table", title2 = NULL, size = 20,
                           bold.lastrow = FALSE, bold.lastcol = FALSE
                           )
{
    ## PURPOSE: Draw a data frame as a R plot. Require R package "gridExtra".
    ## ARGUMENT:
    ##    x: a data frame
    ##    highlight.matrix: if provided a logical matrix (same dimension as "x"). Then "TRUE" cells will be highlighted.
    ##    main: title for the plot
    ##    title2: additional title with more verbose text
    ##    size: text size of table text
    ##    bold.lastrow: if T, make the last row bold font.
    ##    bold.lastcol: if T, make the last column bold font.
    ## RETURN: a plot
    ## DATE: 21 Nov 2016, 15:46
    ## -----------------------------------------------------

    x <- as.data.frame(x)
    n1 <- nrow(x)
    n2 <- ncol(x)
    cl <- matrix("black", n1, n2)
    cl[is.na(x)] <- "gray"

    ## Bold Total Column and Row
    cl2 <- cl
    cl2[] <- "plain"
    if (bold.lastrow) {
        cl2[n1,] <- "bold"
    }
    if (bold.lastcol) {
        cl2[, n2] <- "bold"
    }

    require(gridExtra)
    table_theme <- ttheme_default(base_size = size,
                                  core = list(fg_params=list(col=cl, fontface = cl2)))
    ## Highlight Cells
    if (!is.null(highlight.matrix)) {
        cl3 <- cl
        z <- ttheme_default()$core$bg_params$fill # default color
        z1 <- rep(z, length.out = nrow(cl3))
        for (i in 1:ncol(cl3)) cl3[,i] <- z1
        cl3[highlight.matrix] <- "yellow"
        table_theme$core$bg_params$fill <- cl3
    }

    plot.new()
    gridExtra::grid.table(as.data.frame(x), theme=table_theme)
    ## Title Text
    t2 <- ifelse(is.null(title2), "", paste0("\n", graph.title.split.lines(title2, sep=" ", num.chars = 40)))
    title(main = paste0(main, t2))

}
if (F) {                                # Unit Test
    x <- data.frame(Type=c('Car', 'Plane'), Speed=c(NA, 200))
    my.table.plot0(x)
    my.table.plot0(x, main='Test', title2='a very complex test', size=30, bold.lastcol = T, highlight.matrix = matrix(c(NA, F, F, T) , 2, 2))
    x <- data.frame(Type=rep('Car', 20), Speed=rep(100, 20))
    my.table.plot0(x)
}

my.table.plot <- function(x, highlight.matrix = NULL, bold.lastrow = FALSE, n = 20, ...)
{
    ## Purpose: Split a data frame to fit in each page and call "my.table.plot0".
    ## Arguments:
    ##   x: a data frame or matrix
    ##   highlight.matrix: if provided a logical matrix (same dimension as "x"). Then "TRUE" cells will be highlighted.
    ##   bold.lastrow: if T, make the last row bold font.
    ##   n: how many rows to fit into each page.
    ##   ...: pass to "my.table.plot0".
    ## Return: multiple plots to plot the data matrix.
    ## Author: Feiming Chen, Date:  5 Jul 2017, 15:16
    ## ________________________________________________

    x <- as.data.frame(x)
    N <- nrow(x)
    if ( N <= n ) {
        my.table.plot0(x, highlight.matrix = highlight.matrix, bold.lastrow = bold.lastrow, ...)
    } else {
        s <- rep(seq.int(N %/% 20 + 1), each = n, length.out = N)
        xs <- split(x, s)

        ng <- length(xs)                # number of pages
        bold.lastrow.list <- c(rep(FALSE, ng-1), bold.lastrow)

        if (is.null(highlight.matrix)) {
            mapply(my.table.plot0, xs, bold.lastrow = bold.lastrow.list, MoreArgs = list(...))
        } else {
            ys <- split(highlight.matrix, s)
            mapply(my.table.plot0, xs, highlight.matrix = ys, bold.lastrow = bold.lastrow.list, MoreArgs = list(...))
        }
    }
}
if (F) {                                # Unit Test
     x <- data.frame(Type=rep('Car', 50), Speed=rep(100, 50))
     h <- matrix(rep(c(F, T), 50), ncol=2)
     my.table.plot(x, highlight.matrix = h, bold.lastrow = T)
}


Wednesday, June 21, 2017
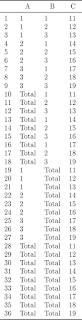
Add a "Total" level to each specified categorical variable in the data frame
df.add.total.category  <- function(dat, var.list, new.level.label = "Total")
{
    ## Purpose: Add a "Total" level to each specified categorical variable in the data frame.
    ## Arguments:
    ##   dat: a data frame with several categorical variables for making tables.
    ##   var.list: a list of variable names in "dat".
    ##   new.level.label: the name for the new "total" level for the specified variable.
    ## Return:
    ## Author: Feiming Chen, Date: 21 Jun 2017, 13:02
    ## ________________________________________________

    if ( missing(var.list) )  {
        var.list <- names(dat)
    }

    d0 <- dat                           # to make new label across all variables
    lapply(var.list,  function( v )  {
        d <- dat
        d[[v]] <- new.level.label
        d0[[v]] <<- new.level.label
        d
    }) -> dd

    do.call(rbind, c(list(dat), dd, list(d0)))
}
if (F) {                                # Unit Test
    dat <- data.frame(A=gl(3,3), B=gl(3, 1, 9), C=11:19)
    df.add.total.category(dat, var.list=c("A", "B"))
}

Monday, June 19, 2017
Put unique elements of a string vector into one long string
paste.unique.string  <- function(x, sep = "/")
{
    ## Purpose: Put unique elements of a string vector into one long string.
    ## Arguments:
    ##    x: a string vector
    ##    sep: what separator to use when pasting all unique elements together.
    ## Return:  a single string with unique elements of "x".
    ## Author: Feiming Chen, Date: 19 Jun 2017, 14:00
    ## ________________________________________________

    paste0(unique(x), collapse = sep)
}
if (F) {                                # Unit Test
    paste.unique.string(c("a", "b", "a", "b")) # "a/b"
}
Add "0" to the front of numbers to make n-digit string
prepend.zero.to.numbers  <- function(x, n = NULL, pad.char = "0")
{
    ## Purpose: Add "0" to the front of numbers to make n-digit string.
    ## Arguments:
    ##   x: a vector of integers/characters
    ##   n: Number of total digits after padding with zero. Default to
    ##      using the largest number to calculate "n".
    ##   pad.char: what character to pad.  Default to "0".
    ## Return: a character vector with nuumbers padded with zero's in the head.
    ## Author: Feiming Chen, Date: 19 Jun 2017, 13:19
    ## ________________________________________________

    x1 <- as.character(x)
    y <- nchar(x1)
    if (is.null(n)) n <- nchar(as.character(max(x)))
    y1 <- n - y                         # how long is the padding for each number
    pad.vector <- sapply(y1, function(w) paste(rep(pad.char, w), collapse = ""))
    paste0(pad.vector, x1)
}
if (F) {                                # Unit Test
    x <- c(2, 14, 156, 1892)
    prepend.zero.to.numbers(x)          # "0002" "0014" "0156" "1892"
    prepend.zero.to.numbers(x, pad.char = "X") # "XXX2" "XX14" "X156" "1892"
    prepend.zero.to.numbers(x, n = 6)          # "000002" "000014" "000156" "001892"
    y <- c("A", "BC", "DEF")
    prepend.zero.to.numbers(y, 3) # "00A" "0BC" "DEF"
}
Parse a string to generate a data frame
parse2data.frame  <- function(x)
{
    ## Purpose: Parse a string to generate a data frame.
    ## Arguments:
    ##   x: a string with header and multiple rows of text that resembles a data frame.
    ##      Fields are separated by comma.
    ## Return: a data frame
    ## Author: Feiming Chen, Date: 19 Jun 2017, 10:12
    ## ________________________________________________

    d <- read.csv(textConnection(x), as.is = T)
    i <- sapply(d, is.character)
    d[i] <- lapply(d[i], trimws)
    d
}
if (F) {                                # Unit Test
    a =
"

  Test, ID, Name
  t1 ,  3,  Sun
  t2 ,  5,  Moon
  t3,   2,  Earth

"
    b <- parse2data.frame(a)
    str(b)
    ## 'data.frame':    3 obs. of  2 variables:
    ##  $ ID  : int  3 5 2
    ##  $ Name: Factor w/ 3 levels " Earth"," Moon",..: 3 2 1
}
Thursday, June 15, 2017
Tokenize a string into a vector of tokens
tokenize.string <- function(x, split = "[ ,:;]+")
{
    ## Purpose: Tokenize a string into a vector of tokens
    ## Arguments:
    ##   x: a string or a vector of strings
    ##   split: split characters (regular expression)
    ## Return: a character vector (if "x" is a string) or a list of character vectors.
    ## Author: Feiming Chen, Date: 15 Jun 2017, 15:01
    ## ________________________________________________

    ans <- strsplit(x, split="[ ,:;]+", fixed=F)
    if (length(x) == 1) ans <- ans[[1]]
    ans
}
if (F) {                                # Unit Test
    x <- "IND,  UNR   INC ; TCU"
    tokenize.string(x)
    ## [1] "IND" "UNR" "INC" "TCU"
    tokenize.string(rep(x, 3))
    ## [[1]]
    ## [1] "IND" "UNR" "INC" "TCU"

    ## [[2]]
    ## [1] "IND" "UNR" "INC" "TCU"

    ## [[3]]
    ## [1] "IND" "UNR" "INC" "TCU"
}
Wednesday, June 14, 2017
Count the number of distinct values in a vector or distinct rows in a data frame
N.levels <- function(x)
{
    ## Purpose: Count the number of distinct values in a vector or distinct rows in a data frame
    ## Arguments:
    ##    x: a vector (numeric or string), or a data frame.
    ## Return: a count for the distinct values/rows in the vector or data frame.
    ## Author: Feiming Chen, Date: 20 Mar 2017, 10:58
    ## ________________________________________________

    sum(!duplicated(x))
}
if (F) {                                # Unit Test
    N.levels(c(1,2,1,3))                # 3
    N.levels(c("a", "b", "a"))          # 2
    x <- data.frame(a=c(1,2,1), b=c(1, 2, 1))
    N.levels(x) # 2
}
Tuesday, June 6, 2017
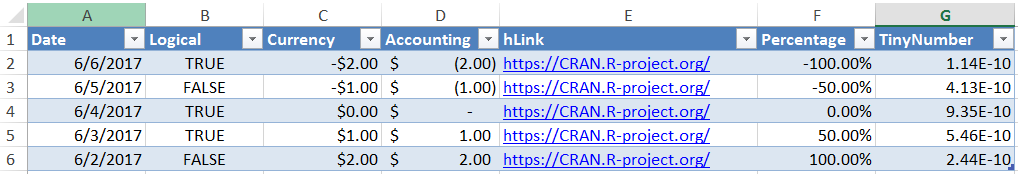
Write data tables to Excel (.xlsx) file
wxls <- function(x, file = "test", ...)
{
    ## Purpose: Write data tables to Excel (.xlsx) file.
    ##          Require package "openxlsx".
    ## Arguments:
    ##   x: a data frame or a list of data frames.
    ##   file: a naked file name with no extension.
    ##   ...: passed to "write.xlsx".
    ## Return: Generate an Excel (.xlsx) file.
    ## Author: Feiming Chen, Date:  6 Jun 2017, 15:11
    ## ________________________________________________

    require(openxlsx)
    f <- paste0(file, ".xlsx")

    write.xlsx(x, file = f, asTable = TRUE,
               creator = "Feiming Chen",
               tableStyle = "TableStyleMedium2",   ...)
}
if (F) {                                # Unit Test
    df <- data.frame("Date" = Sys.Date()-0:4,
                     "Logical" = c(TRUE, FALSE, TRUE, TRUE, FALSE),
                     "Currency" = paste("$",-2:2),
                     "Accounting" = -2:2,
                     "hLink" = "https://CRAN.R-project.org/",
                     "Percentage" = seq(-1, 1, length.out=5),
                     "TinyNumber" = runif(5) / 1E9, stringsAsFactors = FALSE)
    class(df$Currency) <- "currency"
    class(df$Accounting) <- "accounting"
    class(df$hLink) <- "hyperlink"
    class(df$Percentage) <- "percentage"
    class(df$TinyNumber) <- "scientific"

    wxls(df)

    wxls(list(A = df, B = df, C= df))   # write to 3 separate tabs with corresponding list names.
}
Monday, June 5, 2017
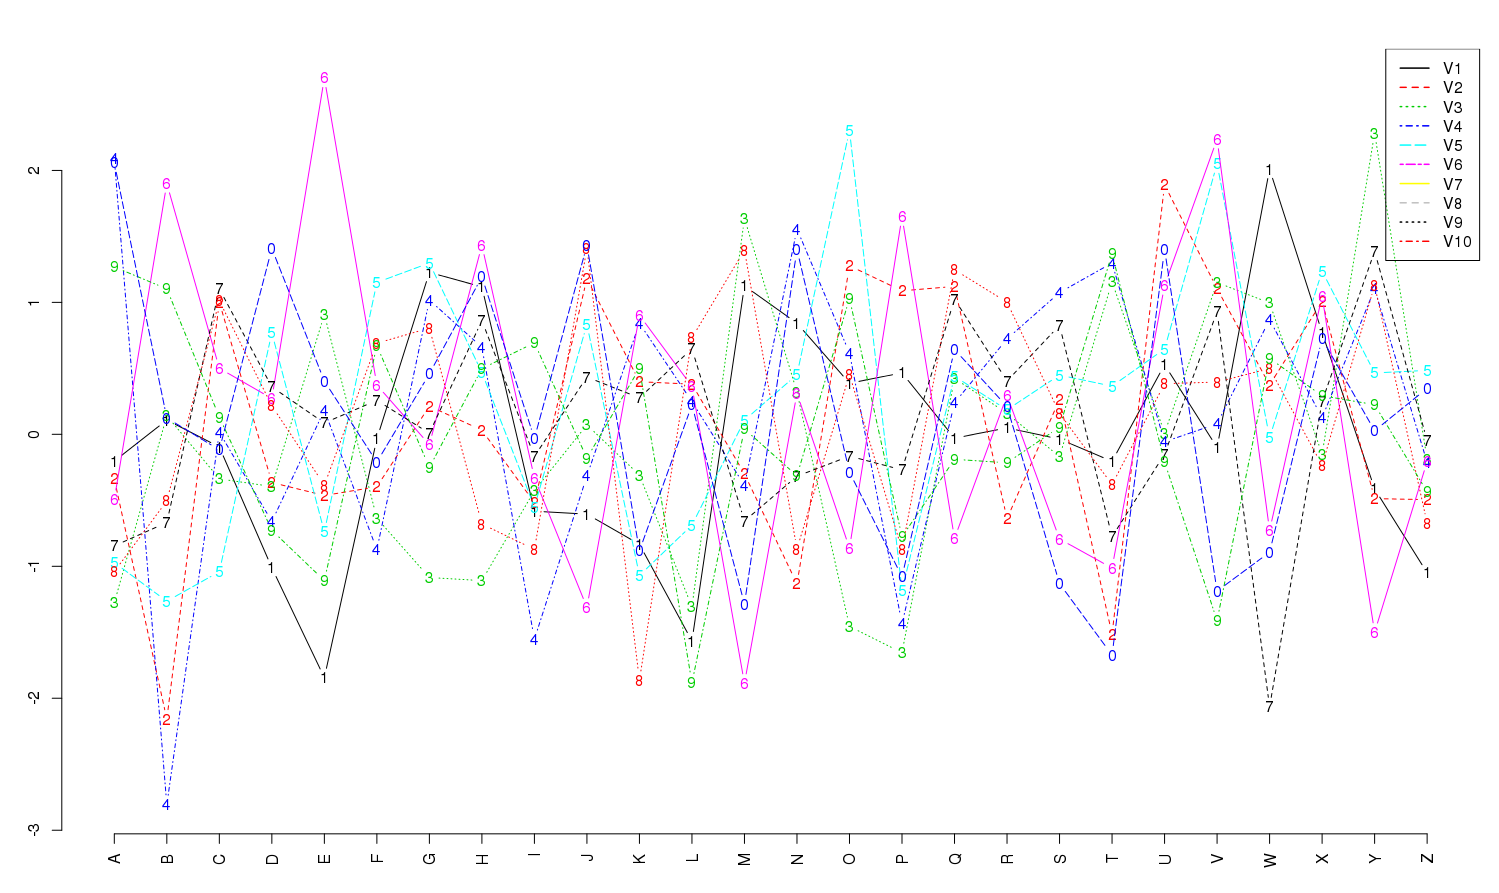
Plot "y" against "x" where "x" is a vector of labels
my.plot.vs.label <- function(x, y, ...)
{
    ## Purpose: Plot "y" against "x" where "x" is a vector of labels (string)
    ## Arguments:
    ##   x: a string vector (labels)
    ##   y: a numeric vector or matrix
    ##   ...: passed to "matplot"
    ## Return: a plot
    ## Author: Feiming Chen, Date:  5 Jun 2017, 14:46
    ## ________________________________________________

    s <- seq(x)
    matplot(s, y, type="b", axes = F, xlab ="", ylab="", ...)
    axis(side=2)
    axis(side=1, at=s, labels=x, las=2)

    yn <- ncol(y)
    yna <- names(y)
    if (!is.null(yn) && !is.null(yna)) {
        legend("topright", legend=yna, col=1:yn, lwd=1.5, lty=1:yn)
    }
}
if (F) {                                # Unit Test
    x <- LETTERS
    y <- matrix(rnorm(260), ncol=10)
    my.plot.vs.label(x, y)
    y2 <- as.data.frame(y)
    my.plot.vs.label(x, y2)
}
Friday, June 2, 2017
Read/Import all CSV files in a specified directory
batch.read.csv.files <- function(p)
{
    ## Purpose: Read/Import all CSV files in a specified directory.
    ##          Require package "readr".
    ## Arguments:
    ##   p: a file directory with CSV files.
    ## Return:
    ##   a list, each element is a data frame (imported from the file) and its name is the corresponding file name.
    ## Author: Feiming Chen, Date:  2 Jun 2017, 11:09
    ## ________________________________________________

    file.list <- list.files(p, pattern=".csv", full.names = TRUE, ignore.case = TRUE)

    if (length(file.list) > 0) {
        dat <- lapply(file.list, readr::read_csv)
        names(dat) <- sapply(file.list, basename)
    } else dat <- list()

    cat("Import", length(dat), "CSV Files.\n")
    dat
}
Subscribe to:
Posts (Atom)