rprof <- function(srcfile)
{
    ## Purpose: R Profiling with R "proftools" package.
    ## Arguments:
    ##   srcfile: path to source file.
    ## Return: plots and summary of profiling.
    ## Author: Feiming Chen, Date: 23 May 2018, 10:31
    ## ________________________________________________

    library(proftools)
    pd0 <- profileExpr(source(srcfile))
    pd <- filterProfileData(pd0, select = "withVisible", skip = 4)

    cat("\nSummarize by function -------------------------------------\n")
    print(head(funSummary(pd, srclines = FALSE), 10))

    cat("\nSummarize by call -----------------------------------------\n")
    print(head(callSummary(pd), 10))

    cat("\nHot Execution Paths ---------------------------------------\n")
    print(hotPaths(pd, total.pct = 10.0))

    plotProfileCallGraph(pd, maxnodes = 15)

    flameGraph(pd)

    calleeTreeMap(pd)

    pd
}
if (F) {                                # Unit Test
    srcfile <- system.file("samples", "bootlmEx.R", package = "proftools")
    rprof(srcfile)
}
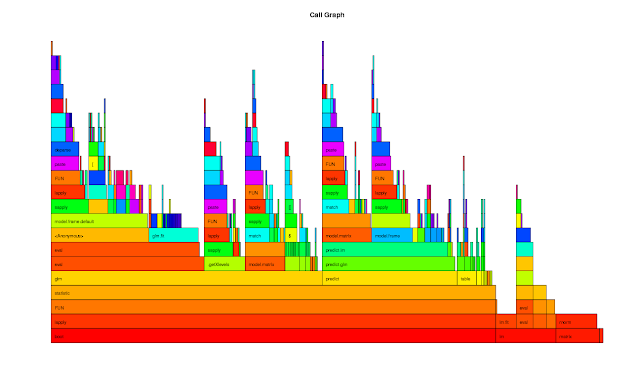
The output of the Unit Test is as follows:
Summarize by function -------------------------------------
                    total.pct gc.pct self.pct gcself.pct
statistic               80.57   7.21     0.66       0.00
lapply                  80.57   7.21     1.75       0.00
FUN                     80.57   7.21     1.97       0.44
boot                    80.57   7.21     0.00       0.00
glm                     49.13   5.24     0.87       0.22
eval                    32.75   1.97     1.97       0.22
model.frame.default     27.51   1.75     1.31       0.00
sapply                  26.42   3.06     0.87       0.00
predict                 24.45   1.53     0.44       0.00
predict.glm             24.02   1.53     0.44       0.00

Summarize by call -----------------------------------------
                                       total.pct gc.pct self.pct gcself.pct
lapply -> FUN                              80.57   7.21     1.09       0.22
FUN -> statistic                           80.57   7.21     0.66       0.00
statistic -> glm (bootlmEx.R:33)           49.13   5.24     0.87       0.22
boot (bootlmEx.R:39) -> lapply             38.21   3.93     0.00       0.00
boot (bootlmEx.R:44) -> lapply             37.55   3.06     0.00       0.00
eval -> eval                               30.13   1.97     0.87       0.22
glm (bootlmEx.R:33) -> eval                27.73   1.75     0.87       0.00
statistic -> predict (bootlmEx.R:35)       24.45   1.53     0.44       0.00
predict (bootlmEx.R:35) -> predict.glm     24.02   1.53     0.44       0.00
sapply -> lapply                           23.14   3.06     1.75       0.00

Hot Execution Paths ---------------------------------------
 path                            total.pct self.pct
 boot (bootlmEx.R:39)            38.21     0.00
 . lapply                        38.21     0.00
 . . FUN                         38.21     0.00
 . . . statistic                 38.21     0.00
 . . . . glm (bootlmEx.R:33)     24.67     0.44
 . . . . . eval                  13.76     0.44
 . . . . . . eval                13.32     0.22
 . . . . predict (bootlmEx.R:35) 12.23     0.00
 . . . . . predict.glm           12.01     0.44
 . . . . . . predict.lm          11.35     0.22
 boot (bootlmEx.R:44)            37.55     0.00
 . lapply                        37.55     0.00
 . . FUN                         37.55     0.00
 . . . statistic                 37.55     0.00
 . . . . glm (bootlmEx.R:33)     24.45     0.44
 . . . . . eval                  13.97     0.44
 . . . . . . eval                13.54     0.00
 . . . . predict (bootlmEx.R:35) 12.23     0.22
 . . . . . predict.glm           12.01     0.00
 . . . . . . predict.lm          11.35     0.44
 lm (bootlmEx.R:52)              10.92     0.00


No comments:
Post a Comment